

Gold holds above $4,150 as the dollar climbs
At 5.22% yields and a rising dollar, gold would normally be crumbling. Central-bank buying is rewriting the playbook.
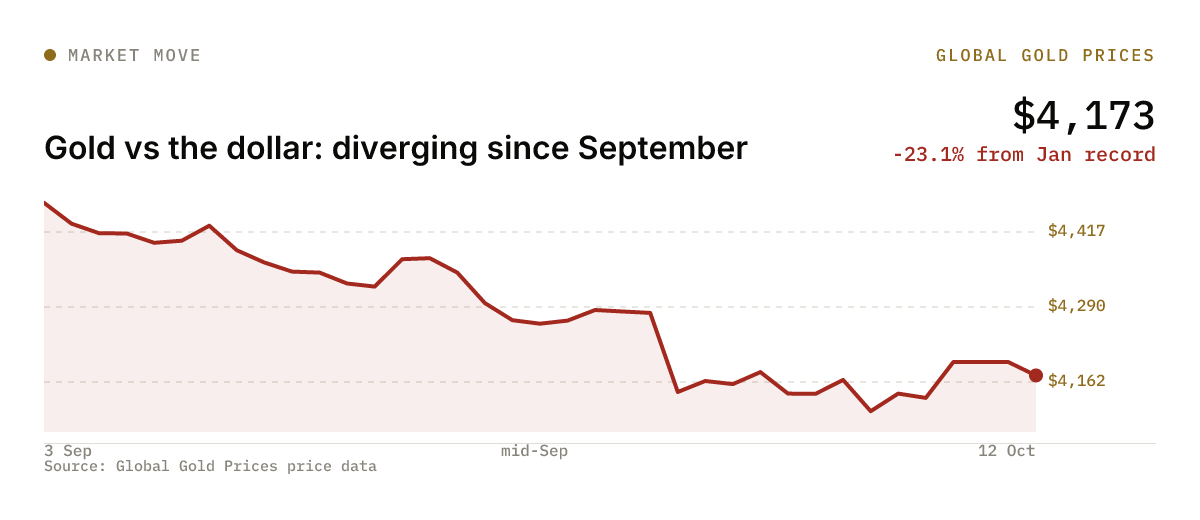
The gold price closed at about $4,173 on Monday, down 0.5% on the day, even as the US 10-year Treasury yield climbed back to 5.22% and the dollar index traded near its highest level since mid-2025. In a normal rate cycle, that combination would push prices sharply lower. Right now it is not.
Why it matters: The usual trade -- sell gold when yields rise and the dollar strengthens -- is not working the way it once did. Investors who are short on a macro basis are fighting a structural buyer that does not care about the daily yield move.
The old relationship is bending
Gold's inverse link to the dollar held firmly through most of 2024 and early 2025. When the dollar rose, gold fell; when the dollar slipped, gold rallied. That relationship has been fraying since September, when gold dropped nearly 7% over three weeks even as the dollar index dipped -- the opposite of what the correlation predicted.
The divergence has continued into October. On our price data going back to 1968, gold is now 23.1% below its all-time high of $5,426 set on 29 January 2026 -- a drawdown that has lasted 257 days. Yet for a correction of this depth, the pace has been slow. Past declines of 20% or more from a record have typically taken hold within 60 to 90 days; this one has spread across nine months, a sign of persistent buying at lower levels. For more on what moves the gold price at this stage of the cycle, see our explainer.
What is holding the floor
The structural support comes from central banks. Since 2022, sovereign buyers -- particularly across emerging markets -- have treated gold dips as accumulation windows rather than exit signals. The buying pace has continued through 2026, absorbing supply that in an earlier cycle would have driven prices toward $3,500. Our central bank gold buying tracker tracks the official-sector data quarter by quarter.
This demand is price-insensitive in a way that speculative flows are not. When US yields jump 6 basis points in a session, managed-money traders trim long positions. Central banks do not.
According to Global Gold Prices price data, the 30-day decline as of Monday was 4.1% -- a drop that, while real, sits in the milder 14% of comparable monthly falls since 1968. In other words, 86% of comparable 30-day stretches have been worse. The chart reads like distribution, but the actual pace of selling is modest.
Wednesday's CPI: the next stress test
The immediate test for this floor is Wednesday's US Consumer Price Index for September. Consensus forecasts compiled by Reuters put headline inflation at 3.6% to 3.7% on a year-on-year basis -- up from 3.4% in August -- with energy costs the main driver. Core CPI is forecast to hold near 2.4%, suggesting that the energy push has not yet spread broadly.
For gold, the scenario that matters most is a core CPI surprise to the upside. That would lift expectations for a December rate hike -- already priced above 80% by CME FedWatch -- and push yields higher. The question is whether central-bank buying is large enough to absorb that additional speculative selling.
If CPI comes in on or below consensus, the relief rally could test the $4,200 to $4,225 zone that has capped every intraday spike since mid-September, according to FXStreet technical analysis. Traders who pressed the breakdown repeatedly over the past month have been stopped out at exactly that level.
Levels that matter
On the downside, $4,100 has held on two separate tests this month -- once after the Fed minutes on 8 October and once after the payrolls release on 7 October. A close below that level would be the first since early August and would likely accelerate speculative selling.
On the upside, a sustained move above $4,225 would put the 200-day moving average back in reach. On our data, the 200-day average currently sits near $4,480, a level gold has not traded at since late September. The gap between spot and the 200-day average -- about 7% -- is narrower than it was at the trough in early October and is itself a sign that the worst of the correction may be behind.
What to watch
- 14 Oct: US September CPI before the New York open. Headline at or above 3.8% would be the bearish signal for gold; core at or below 0.2% month-on-month would give bulls a foothold.
- 27-28 Oct: FOMC meeting. No hike is expected, but the statement's tone on future moves will set the direction into year-end.
- $4,100: The near-term floor on our price data. A close below it changes the technical picture.
More from the Markets desk
All Markets stories →Related reading
- A weak monsoon is the quiet risk to India's Diwali gold season
Rural buyers drive over half of India's gold demand, and this year's monsoon ran 15% below average. Jewellers are split on whether Diwali volumes will fall.
- How to sell gold and get a fair price
Melt value by karat at this week's price, what each kind of buyer pays, hallmarks, tax by country and the warning signs at the counter.
- What moves the gold price: 8 drivers explained
Interest rates, the dollar, central banks, fund flows, Asian demand, inflation, shocks and supply, each sized on our own price data since 1968.