

What moves the gold price: 8 drivers explained
Interest rates, the dollar, central banks, fund flows, Asian demand, inflation, shocks and supply, each sized on our own price data since 1968.

Key points
- Real interest rates and the US dollar set the cost of holding gold, and they usually decide its direction
- Central banks bought more than 1,000 tonnes a year from 2022 to 2024, a slow floor under the market
- Gold hedges inflation over decades, not reliably over a year or two
- Most single-day moves trace back to US data, the dollar or buying in Asia
What moves the gold price comes down to two questions: what it costs to hold gold instead of something that pays interest, and who is buying it. Real interest rates and the US dollar answer the first. Central banks, fund investors and families in India and China answer the second. Inflation, shocks and mine supply matter too, but less often than people think.
The 8 drivers at a glance
- Real interest rates: the cost of holding a metal that pays nothing
- The US dollar: the currency gold is priced in
- Central bank buying: the slow, steady floor under demand
- ETF flows and futures traders: the fast money
- Jewellery and bar demand in India and China: buyers who wait for dips
- Inflation: a long-run hedge, an unreliable short-run one
- Wars and shocks: sharp spikes that often fade
- Mine supply and recycling: big in tonnes, small in daily impact
This guide takes each driver in turn: how it works, how big its effect has been on our own price data going back to 1968, and where to read more. It ends with five questions that explain most single-day moves.
1. Real interest rates: the cost of holding gold
Gold pays no interest, so when interest rates rise, holding it costs more. If a US Treasury bill pays 4% a year, a buyer who chooses gold gives up that 4%. The figure that matters most is the real rate: the yield after inflation. When real yields climb, gold usually falls. We explain the mechanism in why gold falls when interest rates rise and track each Federal Reserve decision on our page on the Fed and the gold price.
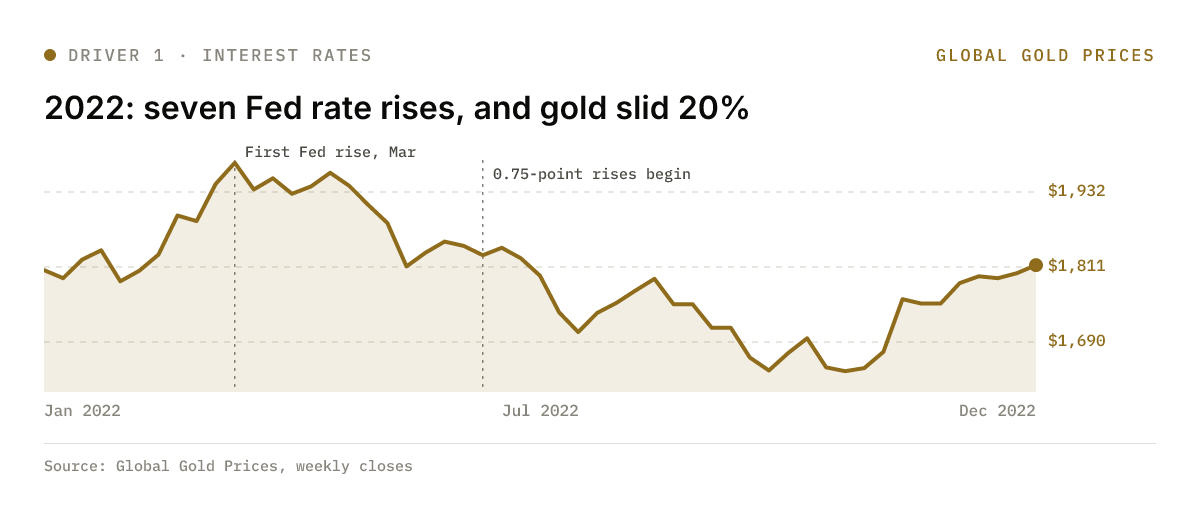
The clearest recent test is 2022, when the Fed lifted rates from near zero at the fastest pace in four decades, with seven rises across the year. On our data, gold fell about 20% from its March 2022 peak near $2,040 to a low near $1,630 in early November, and only recovered once markets began to expect the rises to slow. For the full story on yields, see real yields and gold.
2. The US dollar: why a strong dollar pushes gold down
Gold is priced in US dollars, so a stronger dollar makes every ounce dearer for buyers paying in rupees, yuan, euros or dirhams. They buy less, and the dollar price eases. A weaker dollar works the other way.
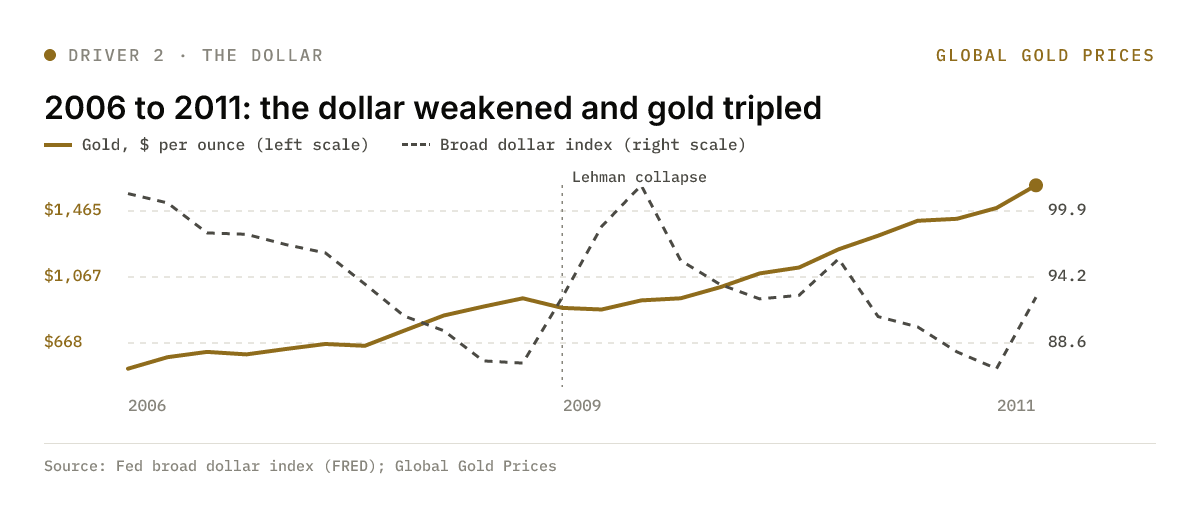
The years from 2006 to 2011 show the rule at its clearest. The Federal Reserve's broad dollar index fell from about 101 to about 86, and gold rose from about $513 to about $1,620 on our data. Only once in that stretch did the dollar rally sharply, during the 2008 banking crisis, and those were gold's worst months.
The link is strong but not fixed. From 2022 to 2025 the broad dollar index averaged between about 120 and 123 each year, its highest annual levels in the series, yet gold more than doubled as central banks bought heavily. In real panic, both the dollar and gold can rise together. Our explainer on why gold and the dollar usually move in opposite directions covers when the rule breaks.
3. Central bank buying: the floor under the market
Central banks are now one of the biggest buyers in the market, and they buy for reasons that have little to do with the day's price: to hold fewer dollars, to guard against sanctions and to back their currencies.
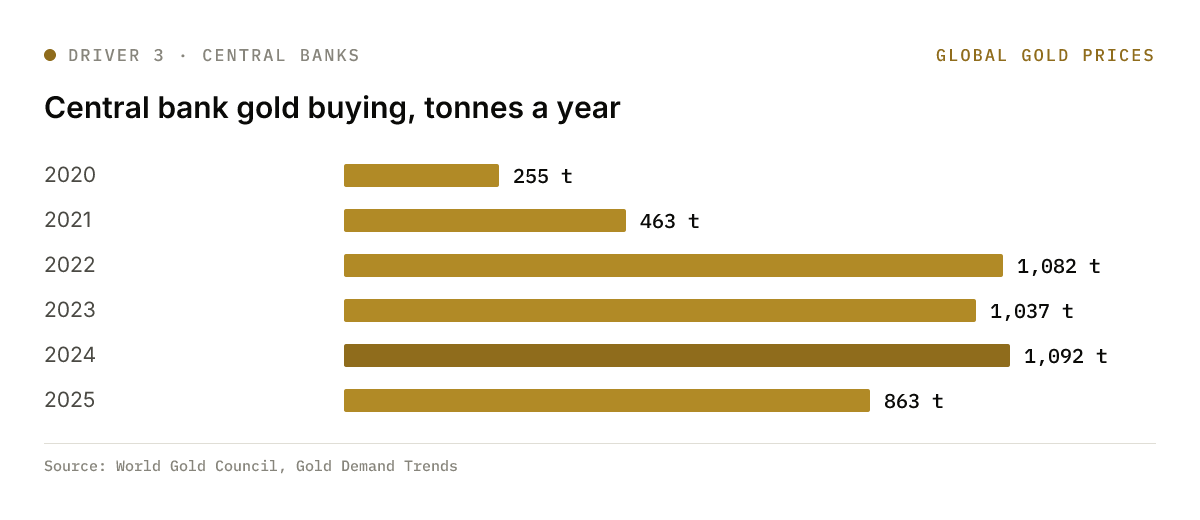
The step change came in 2022. Net purchases rose from 255 tonnes in 2020 and 463 tonnes in 2021 to 1,082 tonnes in 2022, on World Gold Council figures, and stayed above 1,000 tonnes in 2023 and 2024. Buying eased to 863 tonnes in 2025, still more than three times the 2020 level, as prices hit records. We follow the monthly buyers in our coverage, such as China's central bank keeps buying.
This kind of demand moves the price slowly. It rarely explains a single day, but it puts a floor under the market when other buyers step back. Read more in why central banks buy gold and our central bank gold demand report.
4. ETF flows and futures traders: the fast money
Exchange-traded funds let investors own gold through a share in a stock account, with the metal held in a vault. When money pours in, the funds must buy bullion, which supports the price. Swings can be large: gold ETFs took in a net 801 tonnes in 2025, after a small outflow of about 3 tonnes in 2024.
That money is concentrated. On our snapshot of ten US gold funds, SPDR Gold Shares (GLD) alone held more than half of the assets, and GLD plus the iShares Gold Trust (IAU) close to 80%.
Futures are faster still. Hedge funds and other speculators trade gold futures in New York and can flip from buying to selling in days, which is why the price can fall even while ETF investors keep adding. Our guide to what ETF flows signal about investors explains how to read both, and how gold ETFs compare with bars and bonds covers which suits a buyer.
5. Jewellery and bar demand in India and China
India and China are the two largest markets for jewellery, bars and coins, and their buyers are sensitive to price. They mostly cushion falls rather than drive rallies: when gold drops, they buy more; when it soars, they hold back.
2025 showed the second half of that rule. With the average London price up 44% to about $3,432 an ounce, world jewellery demand fell 18% to 1,542 tonnes. Buyers did not leave gold, though: bar and coin demand rose 16% to 1,374 tonnes, as more people bought gold to hold rather than to wear.
Watch the calendar. Indian demand peaks around Diwali and the wedding season, and Chinese demand before Lunar New Year. When Chinese markets shut for Golden Week in early October, an important buyer steps away for a week.
6. Inflation: a long-run hedge, not a short-run one
Over long periods, gold has more than kept up with prices. Over a year or two, it is unreliable.
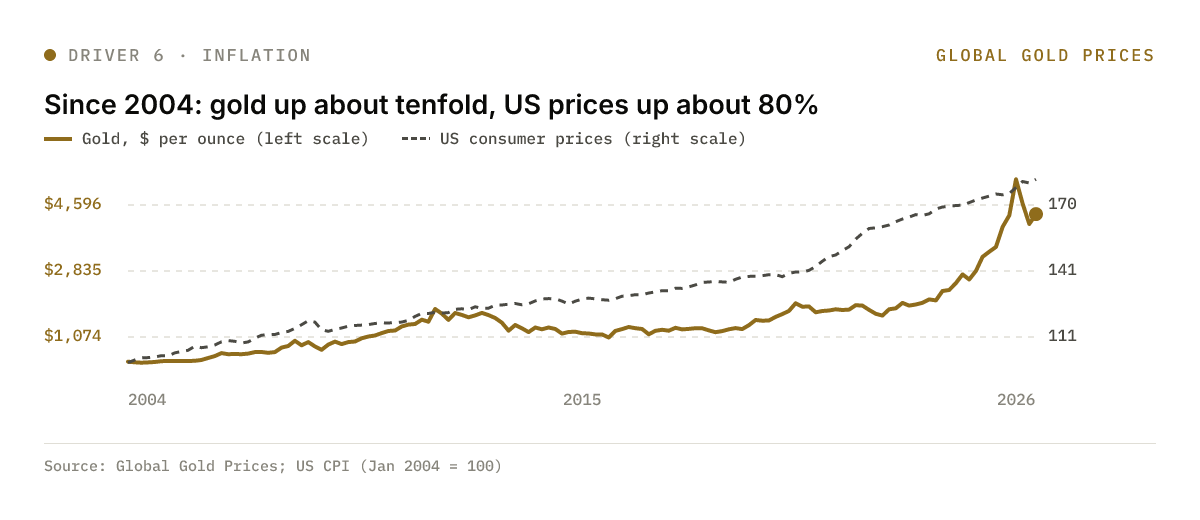
On our data, gold rose from about $416 in January 2004 to above $4,000 by 2025, roughly tenfold, while US consumer prices rose about 80%. The short run is messier. In the year to June 2022, US consumer prices rose about 9% on our index, yet gold ended the period about 3% lower, because the Fed was raising rates hard. Inflation helps gold most when interest rates lag behind it, so real yields fall.
Adjusted for inflation, gold's 2011 peak near $1,895 is worth about $2,800 in current dollars, by our calculation from US consumer prices. More in does gold really protect against inflation?
7. Wars and geopolitical shocks
Shocks send buyers to gold quickly, and the gains often fade just as fast unless the shock changes interest rates, the dollar or central bank behaviour.
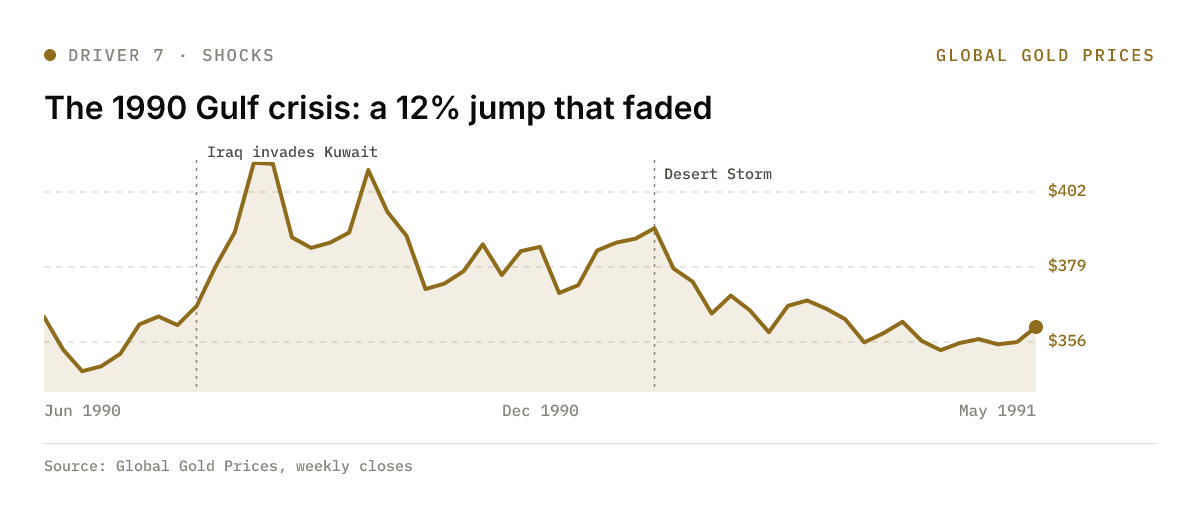
When Iraq invaded Kuwait in August 1990, gold jumped about 12% in three weeks on our data, to about $410. By the time the Gulf War ended in early 1991 it was back below where it started. The pattern repeated in 2022: within two weeks of Russia's invasion of Ukraine, gold reached about $2,040, and a month later it was back near $1,940. Our guide to how geopolitical risk moves the gold price separates the shocks that last from the ones that do not.
8. Mine supply and recycling
Mines produce about 3,700 tonnes a year, and output barely changes because new mines take a decade or more to build.
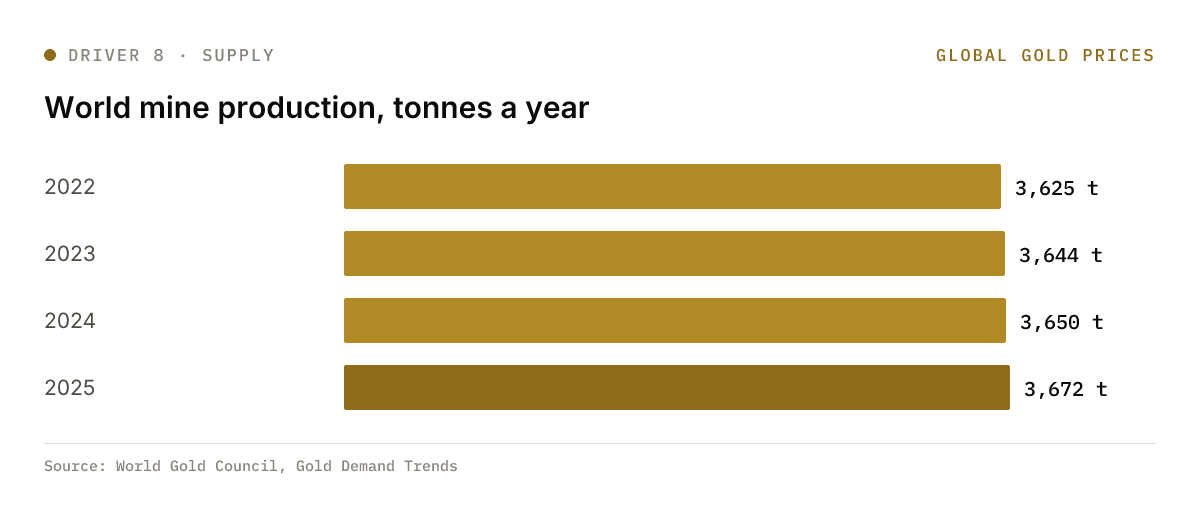
Mine production was 3,625 tonnes in 2022 and 3,672 tonnes in 2025, a rise of barely 1% a year even as the price more than doubled. Recycling is the part that reacts: when prices jump, people sell old jewellery, and recycled supply rose 3% to 1,404 tonnes in 2025. That extra metal can slow a rally, but mine supply shapes the price over years, through costs and discoveries, almost never over a week.
How to read a day's move
When gold moves sharply, five questions get you most of the way to an answer.
- Is the move unusual? Since 1968, the median daily move in gold is about 0.5% either way, and only about 8% of trading days see a move of 2% or more, on our data.
- When did it happen? A move in Asian hours points to Chinese or Indian buying or overnight news. A move in London or New York hours often tracks US data, Fed speakers or the dollar.
- What did the dollar and Treasury yields do? If both fell while gold rose, rates are the story.
- Was there scheduled news? US inflation figures, jobs reports and Fed decisions cause many of the biggest days. See why payroll data moves gold.
- Is it a day or a trend? One day rarely changes the direction set by real rates and central bank buying.
Latest from our desks
- Waller wants more Fed hikes, just not back to back: what the Fed governor's comments mean for rates and gold.
- Gold tests the top of its October range near $4,200: the levels that matter on our price data.
- Brazil gold reserves: why the central bank doubled gold: a new name among official buyers.
- Gold ETFs took in a record $31bn in Q3 as prices fell: fund buyers against futures sellers.
- Gold rises as payrolls miss cuts bets on an October hike: how one jobs report moved gold.
Frequently asked questions
+What is the biggest factor that moves the gold price?
Real interest rates, the yield on bonds after inflation, usually matter most, together with the US dollar. When the Fed raised rates seven times in 2022, gold fell about 20% from its March peak to its November low on our data.
+Why does the gold price fall?
Usually because holding gold has become more expensive: real interest rates or the dollar are rising. Selling by futures traders can make falls sharper, and very high prices can cut jewellery demand in India and China.
+Do central banks control the gold price?
No, but they are among the largest buyers. They bought more than 1,000 tonnes a year from 2022 to 2024, according to the World Gold Council, which supports the price over months rather than moving it day to day.
+Does gold go up when the stock market falls?
Often, but not always. In sharp sell-offs investors sometimes sell gold to raise cash, as in March 2020, before buying it back once the panic eases.
+How much does gold usually move in a day?
Since 1968 the median daily move is about 0.5% either way on our data, and only about 8% of trading days see a move of 2% or more.
Related reading
- A weak monsoon is the quiet risk to India's Diwali gold season
Rural buyers drive over half of India's gold demand, and this year's monsoon ran 15% below average. Jewellers are split on whether Diwali volumes will fall.
- How to sell gold and get a fair price
Melt value by karat at this week's price, what each kind of buyer pays, hallmarks, tax by country and the warning signs at the counter.
- Gold holds above $4,150 as the dollar climbs
At 5.22% yields and a rising dollar, gold would normally be crumbling. Central-bank buying is rewriting the playbook.