

Gold technical analysis: $4,000 lost, $3,950 in view
The $4,070 floor broke on Thursday. Friday closed on the July low, with the year's lowest close next.
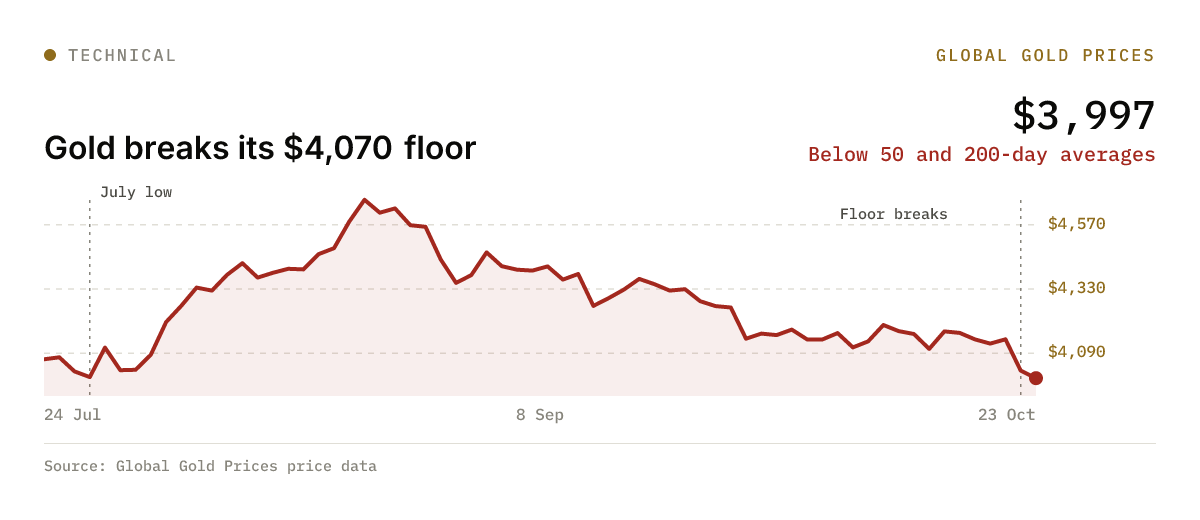
Gold technical analysis turned bearish this week: the $4,070 floor we flagged a week ago broke on Thursday, and Friday's close near $3,997 put the price under $4,000 and below both its 50-day and 200-day averages. The next support on our chart is the year's lowest close, about $3,950.
What broke, and where
Last week the chart had a clear range. Gold had bounced off the $4,070 to $4,110 zone several times in October, and our previous outlook said a close below $4,070 would change the picture. Thursday delivered it, with a 2.8% fall from about $4,142 to about $4,025 in one session.
Friday added a second break. Gold fell through $4,000 in New York trade, touched about $3,979 and closed at about $3,997. That close sits almost exactly on the 17 July close near $3,995, the last time gold finished lower.
The levels that matter now
Support:
- About $3,995: the July low close. Friday's close is resting on it, so the first test comes early next week.
- About $3,950: the lowest close of the past 12 months, set in late October 2025. A daily close below it would take gold to its lowest in more than a year.
Resistance:
- About $4,070 to $4,110: the old October floor. Broken support often becomes resistance, and this zone is the first place a bounce would meet sellers.
- About $4,142: Wednesday's close, the top of the week's range.
- About $4,304: the 50-day average, roughly 7.7% above the price.
The longer trend is also down. The 50-day average sits about 4.7% below the 200-day near $4,515, and the price is under both, which is what chart readers mean by a downtrend on both time frames.
Is gold oversold?
Not yet on the usual measure. Gold's 14-day relative strength index, a gauge that runs from 0 to 100, stands at about 36 on our closing data. Traders usually treat readings under 30 as stretched. So the momentum is weak, but it is not at the kind of extreme that often comes before a sharp bounce.
What stands out is the pace. Gold fell on 15 of the last 22 trading days, a steady grind rather than a crash. Its 30-day realised volatility, the annualised swing in daily prices, is about 17.5% on our data, below its one-year average of about 25% and close to its long-run average of 19% since 1968. In plain terms, gold has fallen a long way without panicking, which suggests orderly selling by funds rather than a rush for the exit.
How do other readings compare?
Most published notes this week agree on the direction. UBS took the other side in an October note, saying it expects buyers to step in around $4,000.
Our own levels sit between those views. The $3,950 low close is the line we would watch first, because it is the one buyers defended a year ago. A move to $3,900 would need a clean close under it.
These are conditions, not calls, and the drivers behind them are covered in our guide to what moves the gold price. A strong reaction to next week's Fed decision could carry gold back above $4,070 quickly, as it did after the late-July meeting, when gold jumped 2.75% the day after the decision.
What to watch
- Mon 26 Oct: whether gold holds the $3,995 July low close in the first session of the week.
- Wed 28 Oct: Fed decision. A daily close back above $4,070 would put the old range back in play.
- Thu 29 Oct: US GDP and PCE inflation, the next likely trigger for a break of $3,950 or a bounce.
More from the Technical Analysis desk
All Technical Analysis stories →Related reading
- Fed rate decision: what gold needs to hear on Wednesday
A hold is priced in. December is the real question, and gold has tended to react a day late this year.
- Gold this week: price breaks below $4,000 as oil lifts rate fears
Week to Friday 23 October, and the week of 26 to 30 October.
- Zimbabwe gold deliveries hit 35.88 t, record year in sight
Small-scale miners supplied about 72% of the gold, and a 4-tonne monthly pace would still beat 2025's record.