

Gold technical analysis: $4,070 floor holds, $4,230 next
Gold sits below all four of its main moving averages, but momentum is flat and volatility is low, which keeps the range intact for now.
Key points
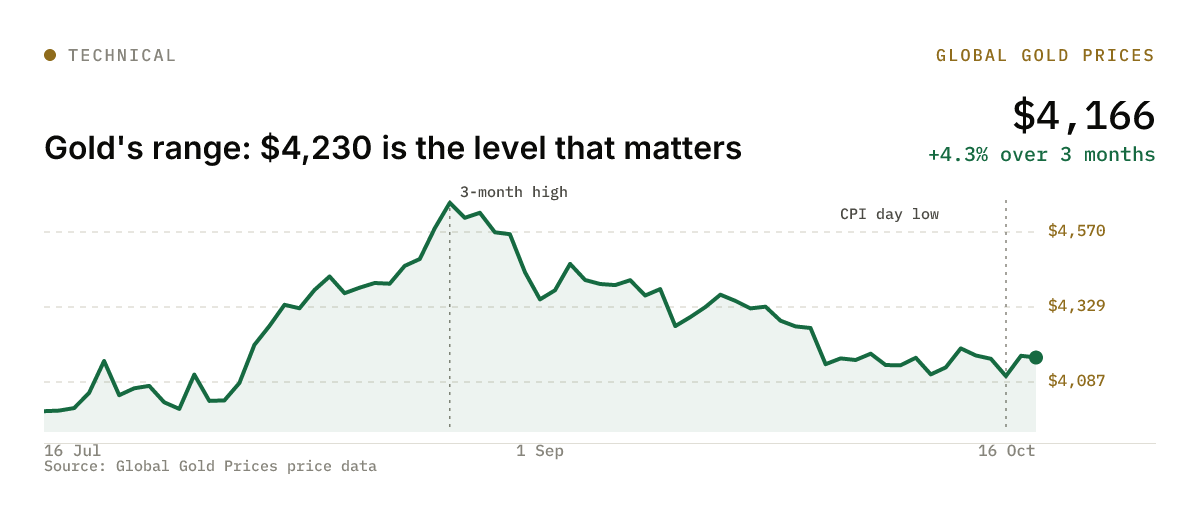
- Gold ended the week near $4,166, down 0.7%, after holding the $4,070 to $4,100 zone on US CPI day
- The 20-day average near $4,189 and the $4,230 range top are the next tests above
- 30-day volatility is 16% annualised on our data, against a one-year average of 25%
- Below $4,070, published bearish targets sit near $4,000 and $3,970
Our gold technical analysis this week comes down to two levels. Gold held the $4,070 to $4,100 floor on Wednesday, dipping to about $4,076 after the US inflation report before closing near $4,106, and finished Friday at about $4,166. Above, $4,230 is the next real test: the top of a range that has held for three weeks.
Where gold stands on our numbers
The week ran from a high of about $4,216 on Monday to that Wednesday low, a $140 spread. Friday's close left gold 0.7% lower on the week, 3.8% lower over a month and 4.3% higher over three months. Earlier this month we wrote about gold testing the top of its October range near $4,200; it has not closed above $4,230 since.
| Level (our data) | Price | Gap from Friday close |
|---|---|---|
| 3-month high | $4,664 | +11.9% |
| 200-day average | $4,528 | +8.7% |
| 50-day average | $4,334 | +4.0% |
| 100-day average | $4,246 | +1.9% |
| 20-day average | $4,189 | +0.5% |
| Friday close | $4,166 | |
| Week's low | $4,076 | -2.2% |
| 3-month low | $3,994 | -4.1% |
Gold sits below all four averages we track. The 50-day, about $170 above the price, is also below the 200-day, so the longer trend still points down. That is the case for caution.
Momentum is flat rather than weak. The 14-day RSI, a gauge of how stretched recent moves are, is about 53, close to the middle of its 0 to 100 scale. Sellers are not in control, and neither are buyers.
The bigger picture: gold is 23% below its record close of about $5,426 on 29 January, 260 days on, according to our gold price history data since 1968. It would need to rise about 30% to get back there.
Do the published charts agree with ours?
Mostly on the floor, less on the direction.
FXStreet's Friday note kept a bullish near-term bias, with the top of the three-week range near $4,230 as the upside goal and initial support near $4,150. Several outlets put support between $4,066 and $4,103, the zone where buyers stepped in more than once this month. Economies.com described $4,100 as the key support, with $4,200 the level that matters above.
On resistance, published research lines up in steps: $4,192 to $4,200 first, then $4,230, then $4,300 to $4,330. We agree with that ladder, and our numbers add weight to the top step. The 50-day average at about $4,334 and the midpoint of the three-month range at about $4,329 both sit inside the $4,300 to $4,330 band. When two separate measures land on the same zone, it tends to be where sellers show up.
Where we differ is on the bias. FXStreet leans bullish. Our read is neutral: a price below every average we follow, with an RSI near 53, does not yet look like the start of a new leg up. It looks like a range.
The bearish voices are further out. RoboForex's 16 October note looked for a renewed slide toward 3,970. Bank of America sees a risk that gold falls below $4,000 within three months, as cited by Mitrade. Our three-month low of about $3,994, set in mid-July, is right where those targets cluster.
The bull case
A daily close above $4,230 would break the three-week range and take gold above both the 20-day and 100-day averages, the latter near $4,246. That would open the way to the $4,300 to $4,330 band.
The best evidence for buyers came on Thursday. Gold rose 1.6%, a daily gain bigger than 93% of trading days since 1968 on our data, the session after Wednesday's 1.3% drop. Buyers who step in that hard at a floor are not ready to give it up.
The bear case
A daily close below $4,070 would mean the floor that held through CPI week has gone. The next marks are the round $4,000 and the three-month low near $3,994, then the 3,970 area RoboForex flagged.
Our averages favour this side. The 50-day is under the 200-day, gold is under both, and the stretch from $4,246 to $4,334 packs three overhead levels into less than $90.
Which level decides it?
$4,230. Our read is that gold stays in the $4,070 to $4,230 box until one side closes outside it, and the top is the side to watch first because the price is nearer to it. A close above it turns the 50-day average into the next target. A failure there for a fourth week would put the floor back in play.
None of this is a trade call. It describes the conditions the chart sets up, and either case can play out.
Why are gold's moves so small right now?
Because volatility has dropped. Gold's 30-day realised volatility is 16% annualised on our data, against an average of 25% over the past year and 14% since 1990. At 16%, a typical week moves gold about 2.2%, or roughly $90 either way. This week's $140 range was wider than that, which is what a CPI shock does, but the market quickly calmed.
Low volatility cuts both ways. It keeps gold inside its range for longer, and a clean break out of the $4,070 to $4,230 box would likely pull volatility back up toward the 25% yearly average.
What to watch
- 22 Oct: Newmont's third-quarter results after the US close, a read on how the biggest gold miner sees prices and costs
- 23 Oct: US flash PMIs, a test of the growth data that feeds Fed rate expectations
- 27 to 28 Oct: Fed policy meeting and decision, the event most likely to push gold out of its $4,070 to $4,230 range
Frequently asked questions
+What is the key support level for gold now?
The $4,070 to $4,100 zone. Gold dipped to about $4,076 on US CPI day this week and closed back above $4,100, and several outlets cite support between $4,066 and $4,103.
+What is the next resistance for gold?
About $4,230, the top of gold's three-week range, then $4,300 to $4,330, where our 50-day average of about $4,334 also sits.
+How far is gold below its record?
About 23% below its record close of about $5,426 on 29 January 2026, on our price data since 1968.
More from the Technical Analysis desk
All Technical Analysis stories →Related reading
- Gold and US inflation: why a hot CPI and PPI did not stick
Consumer prices rose 3.7% and producer prices 6.3%, but traders moved the next Fed hike to December and bond yields fell.
- Gold this week: price shrugs off hot CPI, stalls at $4,200
Weekly performance, Friday 16 October: a US inflation scare, and a bond rally.
- A weak monsoon is the quiet risk to India's Diwali gold season
Rural buyers drive over half of India's gold demand, and this year's monsoon ran 15% below average. Jewellers are split on whether Diwali volumes will fall.