

Gold this week: price shrugs off hot CPI, stalls at $4,200
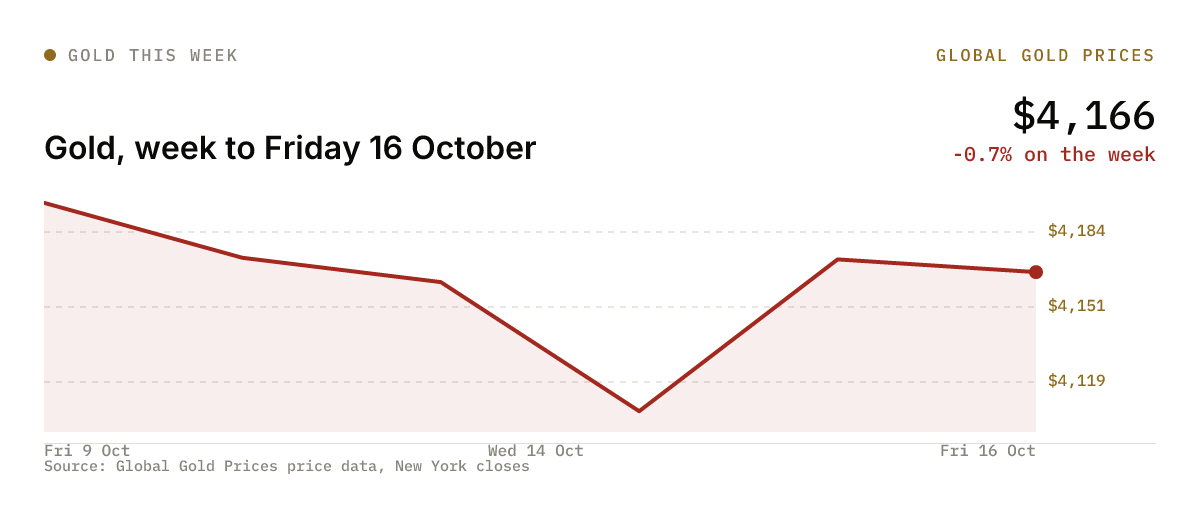
Weekly performance, Friday 16 October: a US inflation scare, and a bond rally.
Key points
- Gold fell 0.7% on the week to about $4,166 after a hot US inflation report
- Thursday's 1.6% rebound was significant
- China's growth figures on Monday and US business surveys on Friday lead next week
- The Fed is in its quiet period before the 28 October decision, so data and oil set the tone
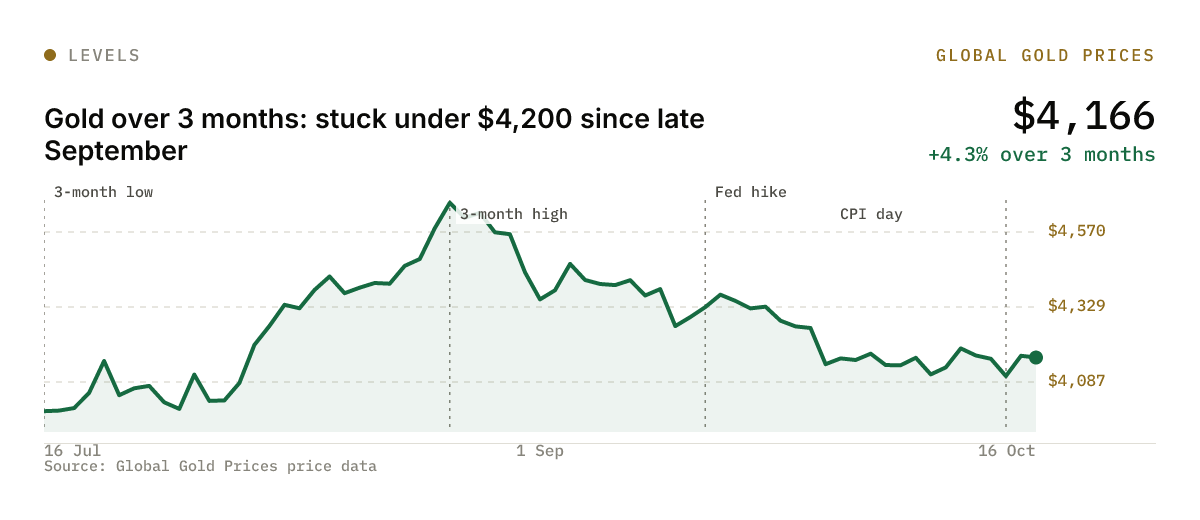
The gold price this week fell 0.7% to about $4,166 an ounce. Hotter US inflation knocked it below $4,100 on Wednesday, falling bond yields lifted it back on Thursday, and it stalled under $4,200 on Friday. Next week's main test is Friday's US business surveys, the last big read before the Fed meets.
Last week in numbers
| Period | Change | Level |
|---|---|---|
| Friday close | $4,166 | |
| 1 week | -0.7% | from $4,196 |
| 1 month | -3.8% | from $4,328 |
| 3 months | +4.3% | from $3,994 |
| Year to date | -3.7% | from $4,328 |
| From the record close | -23.2% | record $5,426 |
What that meant in local money at Friday's close and exchange rates:
| Market | 24K | 22K |
|---|---|---|
| UAE, per gram | AED 491.9 | AED 451.0 |
| India, per gram, before duty and GST | Rs 12,739 | Rs 11,678 |
| Eurozone, per ounce | €3,715 | |
| UK, per ounce | £3,142 |
What moved gold last week
Why did gold drop below $4,100 on Wednesday?
US consumer prices rose 0.6% in September and 3.7% from a year earlier, both above forecasts, according to the Bureau of Labor Statistics release. Traders raised the odds of a Fed hike at the 27 to 28 October meeting to about 40%, and gold fell 1.3% on the day to about $4,106 at the New York close. Its low of about $4,076 was the week's bottom. Silver fared worse, dropping about 6% on the same report.
Why did it bounce on Thursday?
Producer prices jumped 1.3% in the month and 6.3% on the year, yet gold rose 1.6%. A selloff in AI and chip stocks sent money into Treasuries, and the 10-year yield fell sharply. By Friday the 10-year sat near 5.09%, against about 5.24% a week earlier. Lower yields cut the cost of holding a metal that pays nothing, which is how our guide to gold and inflation explains the link.
Why could it not get through $4,200?
Fed Chair Kevin Warsh gave no October signal in Bangkok on Friday, and the odds of an October hike fell to about 16%. But a December hike stayed close to 89%, and Brent crude touched $110 after more attacks on shipping near the Strait of Hormuz. Gold reached about $4,199 and turned back. It had done the same on Monday near $4,216. Two failures in a week make $4,200 the level to beat.
The week ahead
Will Friday's US business surveys revive October hike bets?
S&P Global's flash purchasing managers' surveys for October come out on Friday 23 October. If the price gauges in them run hot, hike odds for 28 October are likely to climb back and gold is likely to slip toward $4,100, because higher rates raise the cost of holding it. If they cool, gold has room to retest $4,200.
Can China's growth figures help?
China publishes third-quarter GDP and September activity data on Monday 19 October; a Reuters poll expects 4.4% growth. A weak figure would raise hopes of lower Chinese rates at Tuesday's loan prime rate fixing. That would likely help gold. The People's Bank of China added about 23 tonnes in September, its 23rd straight month of buying. Shoppers in Shenzhen's Shuibei market also bought the dip over Golden Week.
Levels to watch
Support sits first at $4,100, then at Wednesday's low near $4,076, and then at the three-month low close of about $3,994 from 16 July. Resistance starts at the 20-day average near $4,189 and the $4,200 to $4,216 ceiling. Above that, the 50-day average is about $4,334 and the 200-day about $4,528.
What to watch next week
- Mon 19 Oct: China Q3 GDP and September activity data: the demand outlook in the biggest gold-buying country
- Mon 19 Oct: US NAHB homebuilder index: the first US data of the week
- Tue 20 Oct: China loan prime rates; US September housing starts: a cut in China would support Asian demand
- Wed 21 Oct: UK September CPI; Poland's central bank publishes its official September reserves, after an estimated 25 tonnes of gold buying
- Thu 22 Oct: US jobless claims; Turkey's central bank rate decision; Newmont Q3 results after the close
- Fri 23 Oct: US, eurozone and UK flash PMIs; University of Michigan sentiment: the last big US data before the Fed
Frequently asked questions
+Did gold go up or down this week?
Down. Gold ended the week to Friday 16 October about 0.7% lower at roughly $4,166 an ounce, after falling below $4,100 on Wednesday and recovering most of the loss on Thursday.
+Why did gold fall after the US CPI report?
September consumer prices rose 3.7% from a year earlier, above forecasts, which raised the odds of another Fed rate hike. Higher rates make a metal that pays no interest less attractive, and gold fell 1.3% that day.
+When is the next Fed decision?
The Fed announces its next decision on 28 October, at the end of a two-day meeting. Markets priced about a 16% chance of a hike then, and close to 89% for December, at the end of this week.
+How far is gold from its record?
About 23% below its record close of $5,426 on 29 January 2026, on our price data going back to 1968.
More from the Markets desk
All Markets stories →Related reading
- Gold technical analysis: $4,070 floor holds, $4,230 next
Gold sits below all four of its main moving averages, but momentum is flat and volatility is low, which keeps the range intact for now.
- A weak monsoon is the quiet risk to India's Diwali gold season
Rural buyers drive over half of India's gold demand, and this year's monsoon ran 15% below average. Jewellers are split on whether Diwali volumes will fall.
- How to sell gold and get a fair price
Melt value by karat at this week's price, what each kind of buyer pays, hallmarks, tax by country and the warning signs at the counter.