

Gold and inflation: why an energy shock is hurting gold
Gasoline is up 34% on the year and inflation is back near 4%, yet gold is down. The answer is in how the Fed responds, and history shows both outcomes.
Key points
- US headline PCE inflation rose to 3.6% in September, driven by energy; core was 3.1%
- Gasoline is up about 34% on the year and energy about 20%, according to the BLS
- Gold is down about 3% over the past year, or about 6.4% after inflation on our data
- The difference is the Fed: energy inflation has brought hikes, and hikes are winning
Gold and inflation are supposed to move together, but this autumn they have split. US headline PCE inflation reached 3.6% in September on rising energy costs, while gold fell about 3% over the past year to near $3,876. The reason is the Federal Reserve's answer to the energy shock: higher rates, which hurt gold more than inflation helps it.
Why it matters: Many people buy gold as an inflation hedge. This year shows the hedge works on a long view but can fail for months when the central bank fights inflation hard, so the timing of the Fed's last hike matters more than the inflation rate itself.
How much of inflation is energy?
Most of the jump. The Bureau of Labor Statistics said the energy index rose 5.2% in September alone and 20.4% from a year earlier, with gasoline up 9.1% on the month and 34.2% on the year. Gasoline accounted for more than half of the monthly rise in consumer prices.
Strip food and energy out and the picture is calmer. Core CPI rose 0.3% in September and 2.6% over the year. The PCE gauge the Fed targets shows the same split: the Bureau of Economic Analysis reported a 0.5% monthly rise in headline PCE prices in September, 3.6% over the year, against 0.3% and 3.1% for the core measure.
So roughly half a point of the PCE rate, and more than a point of CPI, is energy. That gap is the whole argument about what the Fed should do.
Should the Fed look through an oil shock?
Textbook policy says a central bank can ignore a one-off jump in oil prices, because it raises the price level once rather than feeding a lasting spiral. The risk is that it does not stay one-off: higher fuel costs leak into transport, food and wages, and people start to expect higher prices.
The Fed under Kevin Warsh has chosen not to wait. It raised rates in September for the first time since 2023 and held them at 3.75% to 4% on Wednesday, with two officials voting for another increase. Warsh said the Fed would not tolerate inflation settling "somewhere in the twos". Our preview of the Fed decision said gold needed a signal of patience; a firm line on inflation was the opposite.
Markets believe him. Futures put the chance of a December hike at about 76% at Friday's close, according to the CME FedWatch reading cited by Capp Notes, after readings above 80% on Wednesday night reported by Daily Economics.
Why is gold falling if inflation is rising?
Because gold competes with interest-bearing assets, and those now pay more. The 10-year Treasury yield rose to about 5% after the Fed meeting. Even after inflation, the 10-year TIPS yield, the market's real rate, sat around 2.6% to 2.7% in late October, according to a tracker of the Treasury series. Holding gold means giving that up.
Gold tends to win on inflation when real yields fall, which happens when prices rise faster than the central bank is willing to lift rates. It loses when the central bank moves first and hard, which is what the Fed is doing now.
There is a twist in the latest week. Real yields eased from about 2.9% early in October to about 2.6% by 29 October, yet gold fell more than 6% over the month. That is not how the textbook says it should behave, and it points to selling by investors who had piled in near the record rather than a pure rate effect. We looked at the same puzzle after September's hot CPI and PPI prints, when an inflation scare failed to stick to the price.
What does history say about gold in energy shocks?
It depends on the central bank, and our price data since 1968 has both kinds of episode.
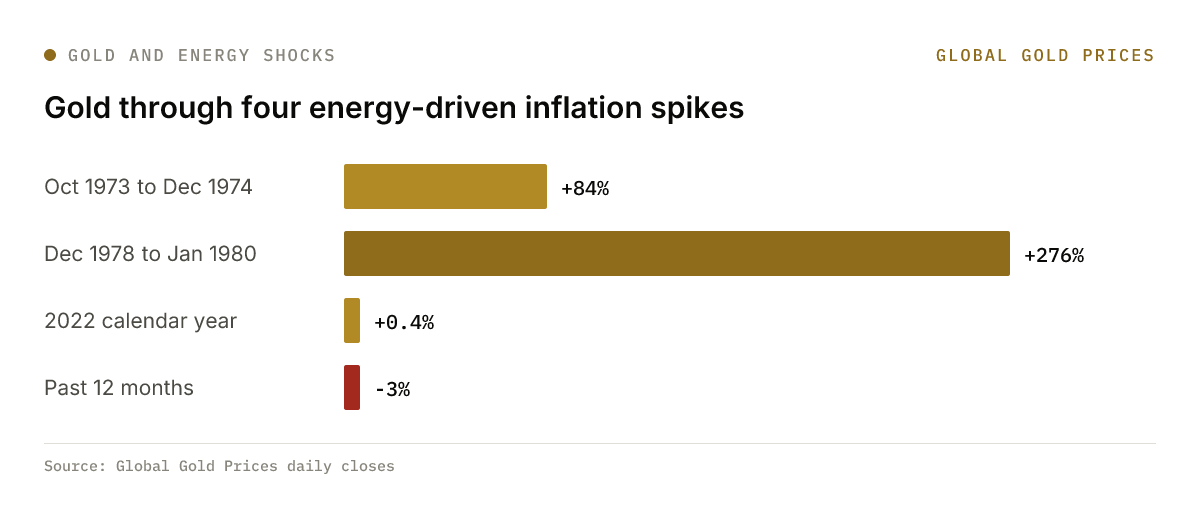
From the start of the oil embargo in October 1973 to the end of 1974, gold rose about 84%, from near $101 to near $187. From the end of 1978 to the January 1980 peak, after the Iranian revolution doubled oil prices, it rose about 276%, from about $226 to $850. In both cases the Fed was slow, real rates were negative and gold was the escape.
In 2022 the energy shock from the war in Ukraine pushed US CPI above 9%, but the Fed hiked fast. Gold finished the year almost exactly where it started, up about 0.4% on our data, after falling about 15% between March and November. Real rates went from deeply negative to positive, and that cancelled the inflation effect.
The past 12 months look more like 2022 than 1979. Gold is down about 3% while consumer prices rose about 3.7% on the CPI series we hold, which leaves it down about 6.4% in real terms over the past year. Adjusted for US inflation since January, the record near $5,426 would be about $5,620 now, so the gap from the inflation-adjusted peak is about 31%.
Is there a regime shift?
That is the argument some market writers are making. If that is right, the long-run case for gold strengthens: a world of structurally higher inflation is the one where real assets earn their keep.
Our read is that the shift, if it comes, is a 2027 story for gold, not a November one. For now, every hot energy print raises hike odds first. Gold needs one of two things to turn: the Fed signalling it is done, or inflation spreading so widely that real rates fall despite the hikes. Neither is visible yet. Core inflation at 2.6% on CPI says the spread has not happened.
What would change the picture?
Three signals to track, in order of importance.
First, core inflation. If the energy shock starts to show up in services and wages, core PCE will climb above 3.1% and the Fed's job gets harder, not easier. That is the 1970s path, and it ends well for gold, but it takes time and more hikes first.
Second, oil itself. A ceasefire or a supply response that pulls gasoline back would cool headline inflation quickly and lower hike odds. That would likely lift gold through lower real yields, the reverse of this autumn's pattern.
Third, the December meeting. A hike paired with a signal that the cycle is over would mark the moment real yields can peak. Our data shows gold has risen in the six months after the last hike in each of the past three cycles. For background on that link, see why gold falls when rates rise.
What to watch
- 2 Nov: US ISM manufacturing survey, whose prices-paid index shows how far fuel costs reach factories
- 6 Nov: US October jobs report, the wage numbers that decide whether energy spreads
- 9 Dec: Fed decision, about 76% priced for a hike
More from the Macro & Policy desk
All Macro & Policy stories →Related reading
- Gold Performance 3rd November: gold price slips, US vote count up next
Tuesday 3 November: a firmer dollar and rising Treasury yields pulled gold back below $3,950 as Americans voted and bets on a December Fed hike climbed.
- Gold Performance 2nd November: gold price jumps 1.8%, US vote up next
Monday 2 November: a 7% slide in oil on hopes of US talks with Iran eased Fed hike bets and gave gold its best day since early September.
- US GDP and PCE: what yields and GLD did to the gold price
Strong growth and sticky core inflation kept the Fed on course to hike, but the dollar and real yields eased. GLD holders sold anyway.