

US GDP and PCE: what yields and GLD did to the gold price
Strong growth and sticky core inflation kept the Fed on course to hike, but the dollar and real yields eased. GLD holders sold anyway.
The gold price in the US fell to a one-year low near $3,876 on Friday after two strong US data releases: third-quarter GDP growth of 3.4% and core PCE inflation steady at 3.1%. The odd part is that the dollar and real yields eased over the same days. GLD investors sold anyway.
Why it matters: For US buyers, the usual signals pointed the right way for gold this week and the price still fell. That tells you the selling came from positioning and rate-hike fear, not from a stronger dollar, which shapes how quickly a rebound could come.
What did the data show?
The Bureau of Economic Analysis said real GDP grew at a 3.4% annual rate in the third quarter, up from 2.2% in the second and above the 3.2% consensus. Inventories added to the headline and imports of computers subtracted from it. It is an advance estimate; the second reading is due on 25 November.
The same Thursday brought September's personal income and outlays report. Headline PCE prices rose 0.5% on the month and 3.6% from a year earlier. The core index, which strips out food and energy, rose 0.3% and 3.1%. Spending rose 0.5% while income rose only 0.2%, so households drew on savings to keep buying.
There was one softer detail. Core PCE for the whole third quarter rose at a 2.5% annual rate, down from 3.3% in the second quarter, according to the GDP release. Quarterly inflation is cooling even as the yearly rate stays high.
How did gold trade on the numbers?
Barely, at first. Our intraday data shows gold near $4,020 when the figures landed at 8:30 am New York time, rising briefly to about $4,036 before giving it back. It closed Thursday near $4,023, down about 1.1%.
Friday was the real move: a 3.6% drop to about $3,876, the lowest close in a year. Most of the fall came after the New York open.
Did real yields and the dollar push gold down?
No. That is what makes this week unusual for American investors.
The 10-year TIPS yield, the market's real interest rate, fell about 4 basis points to roughly 2.63% on Thursday, according to a tracker of the Treasury series, after rising 3 points on Fed day. It had been closer to 2.9% early in the month. Lower real yields normally lift gold.
The dollar index slipped to about 101.9 by Friday's close, below Wednesday's high near 102.3, and the 2-year Treasury yield fell to about 4.56%, according to a market close summary from Capp Notes. A weaker dollar makes gold cheaper for buyers abroad and usually helps it.
So the two classic drivers both moved in gold's favor, and gold still lost about 4.7% from Wednesday's close. Our guide to what moves the gold price explains the usual pattern; this week broke it.
Who was selling?
ETF holders were part of it. The largest US gold fund, SPDR Gold Shares (GLD), saw about $1.1 billion leave in the latest week, according to a flow tracker that labels the figure provisional. That followed heavy outflows the week before. Across the nine funds the tracker follows, net outflows were about $662 million, so some money moved from GLD to cheaper rivals rather than out of gold.
That fits a trend we covered in October: low-fee gold ETFs have taken about 15% of the market as investors switch to funds with lower costs.
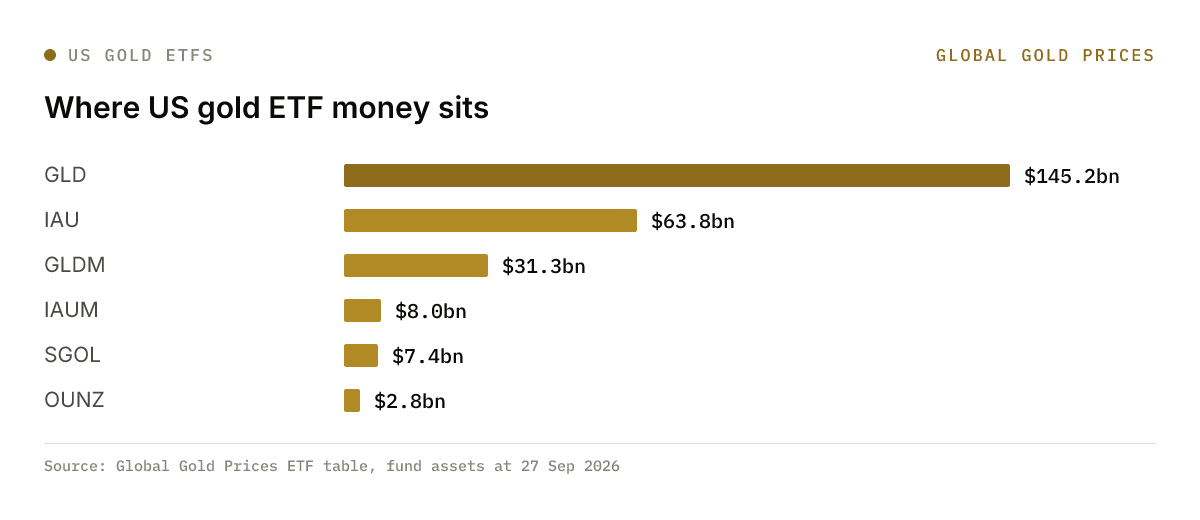
GLD and IAU still dominate. On our latest snapshot of fund assets, GLD held about $145 billion and IAU about $64 billion, together about 79% of the roughly $263 billion held by the US gold ETFs we track. When those two see selling, the price feels it.
Why are US investors leaving gold now?
Rates and the alternatives. The Fed is about 76% priced to hike again on 9 December, and stocks keep rising. On our data the S&P 500 is up about 10.7% this year while gold is down about 10.4%, a gap of roughly 21 points. The ratio of gold to the S&P 500 has fallen from about 0.63 at the end of 2025 to about 0.51.
With growth at 3.4% and equities near highs, the case for holding a metal that pays nothing has weakened for many US portfolios, even as inflation runs well above target.
What to watch
- 2 Nov: ISM manufacturing survey, the first activity read since GDP
- 6 Nov: October jobs report, which will set December hike odds
- 25 Nov: second estimate of Q3 GDP
More from the North America desk
All North America stories →Related reading
- Gold Performance 3rd November: gold price slips, US vote count up next
Tuesday 3 November: a firmer dollar and rising Treasury yields pulled gold back below $3,950 as Americans voted and bets on a December Fed hike climbed.
- Gold Performance 2nd November: gold price jumps 1.8%, US vote up next
Monday 2 November: a 7% slide in oil on hopes of US talks with Iran eased Fed hike bets and gave gold its best day since early September.
- Gold and inflation: why an energy shock is hurting gold
Gasoline is up 34% on the year and inflation is back near 4%, yet gold is down. The answer is in how the Fed responds, and history shows both outcomes.