Gold price history and the all-time high
From $38 an ounce in 1968 to a $5,426 record in January 2026: the bull runs, the crashes and the inflation-adjusted peak, on our own daily data.
Key points
- Gold's all-time high on our data is a $5,426 daily close on 29 January 2026
- In mid-October 2026 gold traded near $4,200, about 23% below that record
- Adjusted for US inflation, the 1980 peak of $850 is worth about $3,660 today, a level gold passed in September 2025
- Past falls of 25% or more took anywhere from six months to 28 years to recover
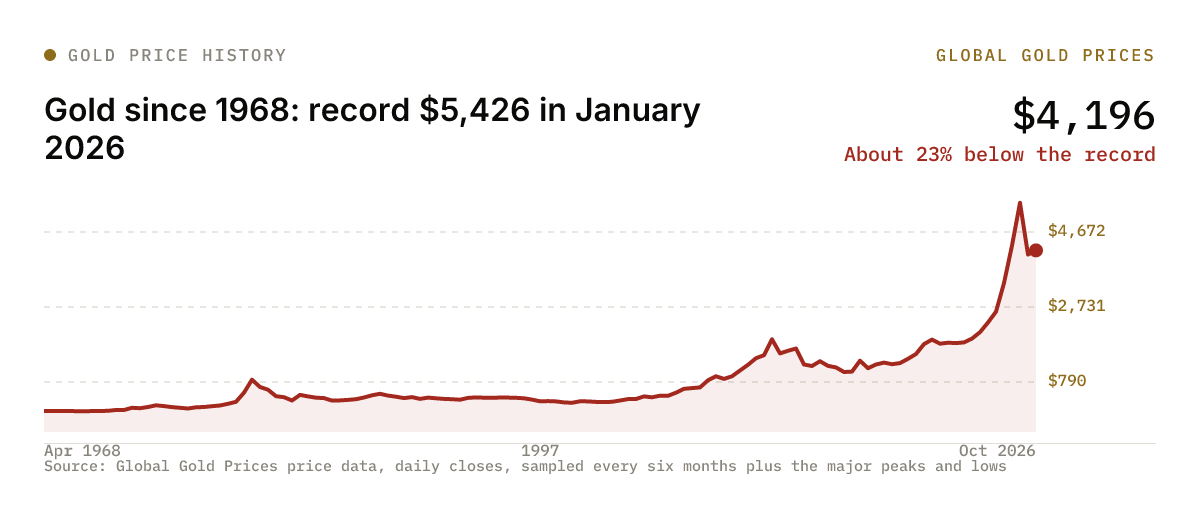
Gold price history in one line: an ounce cost about $38 when our daily series starts in April 1968 and traded near $4,200 in mid-October 2026, roughly 111 times more. The all-time high is $5,426, set on 29 January 2026, about 23% above that October level.
That works out to an average gain of about 8.4% a year over 58 years, on our price data. The path was anything but smooth: three great bull runs, two long bear markets and a handful of days when the price moved more than 10% between one close and the next.
What is the all-time high for gold?
The record close on our data is $5,426 an ounce, reached on Thursday 29 January 2026. Trading during that session went higher still: gold touched an intraday high near $5,600, according to WisdomTree, before reversing.
A day later gold fell 5.7% on our closing prices, its biggest one-day drop since June 2013. President Donald Trump had named Kevin Warsh as his choice to lead the Federal Reserve, which lifted the dollar and pulled metals lower. The run into the peak had been extreme as well: gold rose 24% in the 30 days to the record, the steepest 30-day climb since October 1999 on our data.
Before 2026, the record was reset in stages: a close above $1,000 in March 2008, about $1,900 in September 2011, above $2,000 in August 2020 and above $4,000 during 2025.
How has the gold price changed since 1968?
The table shows the price at the turning points that shaped the last six decades, from our daily closes.
| Moment | Gold, $ an ounce | What happened |
|---|---|---|
| April 1968, start of our series | 38 | Official price still $35 |
| January 1980 peak | 850 | Inflation scare, record for 28 years |
| July 1999 low | 253 | Low point of a 19-year bear market |
| September 2011 peak | 1,895 | Post-crisis high |
| December 2015 low | 1,049 | End of a 45% fall |
| August 2020 peak | 2,067 | Pandemic rally |
| January 2026 record | 5,426 | All-time high |
| July 2026 low | 3,994 | Low of the 2026 correction |
| Mid-October 2026 | 4,196 | About 23% below the record |
Up to August 1971 the United States still exchanged dollars for gold with other governments at $35 an ounce under the Bretton Woods system, according to the Federal Reserve's history of the period. President Richard Nixon closed that window in 1971, and gold has floated freely since.
What were gold's biggest bull markets?
Three runs account for most of the long-term gain, on our data.
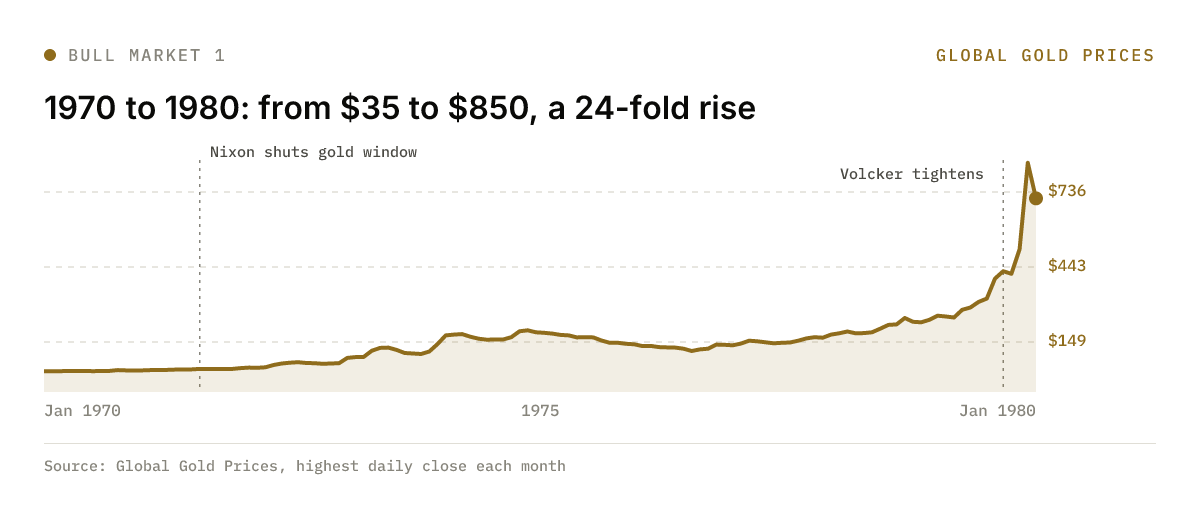
1970 to 1980: from $35 to $850
From about $35 to $850, a 24-fold rise in ten years. Gold's best calendar year on record was 1979, up 127%. Inflation was running near 9% that summer, and on 6 October 1979 Fed Chair Paul Volcker announced the tightening that would later push the federal funds rate to 20%.
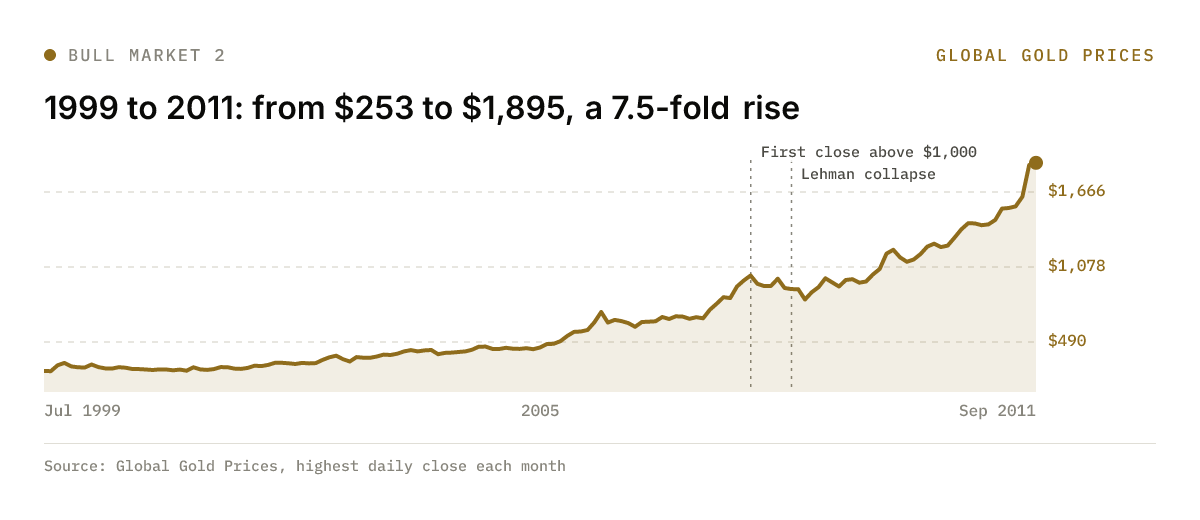
1999 to 2011: from $253 to $1,895
From $253 to $1,895, a 7.5-fold rise over twelve years, carried by a weaker dollar and the 2008 financial crisis. Gold first closed above $1,000 in March 2008 and, after a sharp dip around the collapse of Lehman Brothers, climbed for three more years.
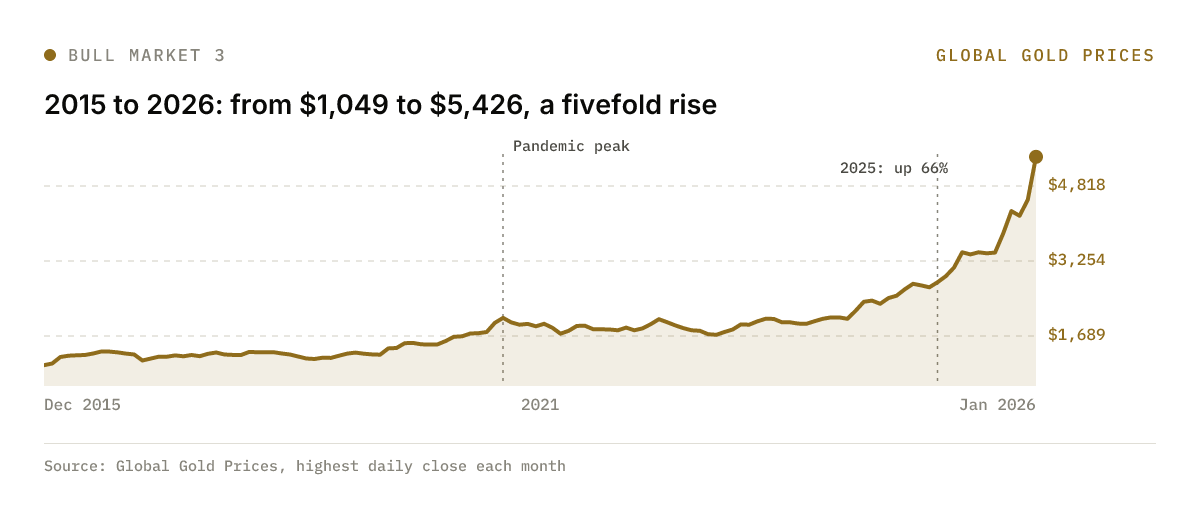
2015 to 2026: from $1,049 to $5,426
From $1,049 to $5,426, a fivefold rise over ten years. In 2025 gold gained 66%, its best year since 1979, as central banks bought heavily. Our central bank gold buying tracker follows that demand month by month.
What were the worst gold crashes, and how long did they take to recover?
Every big bull market ended in a deep fall. This table lists each time gold dropped 25% or more from a record, with the time it took to close above that record again.
| Fall from record | Peak | Depth | Time to a new record |
|---|---|---|---|
| 1973 | $127 | 29% | 6 months |
| 1974 | $180 | 28% | 7 months |
| 1974 to 1976 | $195 | 47% | 3 years 7 months |
| 1980 to 1999 | $850 | 70% | 28 years |
| 2008 | $1,011 | 30% | 1 year 6 months |
| 2011 to 2015 | $1,895 | 45% | 8 years 10 months |
| 2026 so far | $5,426 | 26% at the July low | Not yet |
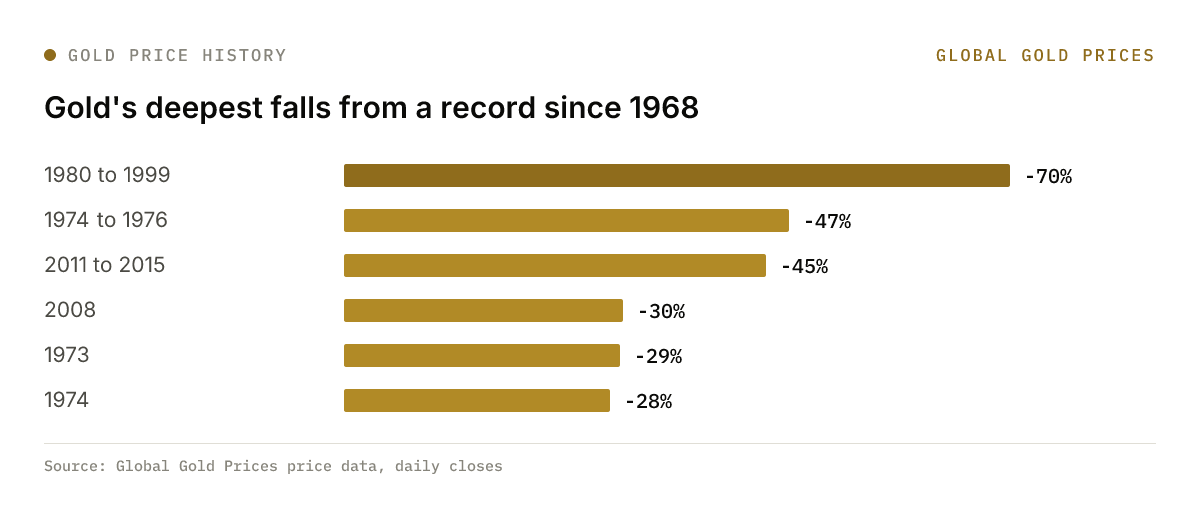
The 1980s and 1990s were the hard lesson. Gold lost 70% of its dollar price between January 1980 and July 1999, and an ounce bought at the 1980 peak did not close above its purchase price until January 2008. Central bank selling added to the pressure late in that decline: in September 1999, 15 European central banks agreed to cap their combined sales at about 400 tonnes a year, according to the World Gold Council, a pact that marked the turn.
The 2011 to 2015 bear market included the crash of 15 April 2013, when gold fell 9.2% in a day on our closing prices. Calendar 2013 was the second-worst year in our data, down 27%, behind only 1981 at minus 33%. The shallower fall after the 2020 pandemic peak, about 21%, took three years and five months to recover.
What were gold's biggest one-day and one-month moves?
The most violent days all cluster around the 1980 peak. On our data:
- Biggest one-day rise: 13.3% on 3 January 1980
- Biggest one-day fall: 13.2% on 22 January 1980, the day after the record close
- Biggest 30-day rise: about 80% in the 30 days to 21 January 1980
- Biggest 30-day fall: 29% in the 30 days to 20 February 1980
Moves like this are rare. A daily fall of 5.7% or more, the size of January 2026's drop, has happened on only about one day in 700 since 1968. Our explainer on how geopolitical risk moves the gold price covers what tends to drive the sharpest days.
What is the inflation-adjusted record for gold?
Adjusted for inflation, the record is still the January 2026 peak, worth about $5,590 in August 2026 dollars on US consumer prices. In mid-October 2026 gold was about 25% below that real high.
The more striking finding is how the old 1980 peak looks after inflation. Using the US Bureau of Labor Statistics consumer price index, $850 in January 1980 equals about $3,660 in August 2026 money. Gold first closed above that level on 3 September 2025, on our calculation, so for most of the past 45 years the 1980 peak remained the true high once inflation is counted. The 2011 peak of $1,895 is worth about $2,800 today.
For how well gold has kept pace with prices over shorter spells, see our guide on whether gold really protects against inflation.
Where does the gold price sit today in its history?
In mid-October 2026 gold traded near $4,200, about 260 days after its record and about 23% below it. The low of the 2026 correction came in mid-July, just under $4,000 and 26% below the peak.
History says a fall of this size is common and recovery can be slow. Of the six earlier falls of 25% or more from a record, the quickest were regained in six to seven months (1973 and 1974); the slowest took 28 years. Gold has also spent most of its life below a record: on our data it was at least 23% below its then high on about 61% of days since 1968, and within 1% of a record on only about 5.5% of days.
What usually decides the next leg is the price of money. When US interest rates and the dollar rise, gold tends to struggle, as our explainers on why gold falls when interest rates rise and how Fed decisions move gold set out.
Latest from our desks
- Gold tests the top of its October range near $4,200: the price against its October range
- Gold climbs to $4,190 as Trump rules out Iran strikes: the latest geopolitical move
- Gold slips to $4,104 as Fed minutes keep hikes in play: why rate hikes still weigh on gold
- Gold ETFs took in a record $31bn in Q3 as prices fell: investors bought the correction
- Brazil gold reserves: why the central bank doubled gold: official buying beyond China
Frequently asked questions
+What is the highest price gold has ever reached?
On our daily closing prices the record is $5,426 an ounce, set on 29 January 2026. Intraday trading that day reached close to $5,600.
+What was the price of gold in 1980?
Gold peaked at $850 an ounce on 21 January 1980 on our data and ended 1980 near $590. That $850 is worth about $3,660 in August 2026 dollars.
+How long did it take gold to recover from the 1980 crash?
Gold did not close above its 1980 high of $850 again until January 2008, almost 28 years later, after falling as far as $253 in July 1999.
+How much has gold gone up since 1968?
From about $38 in April 1968 to about $4,200 in mid-October 2026, gold has risen roughly 111 times, an average gain of about 8.4% a year on our data.
+What was gold's best year?
1979, when gold rose 127% on our data. The best year since then was 2025, up 66%.
Related reading
- A weak monsoon is the quiet risk to India's Diwali gold season
Rural buyers drive over half of India's gold demand, and this year's monsoon ran 15% below average. Jewellers are split on whether Diwali volumes will fall.
- How to sell gold and get a fair price
Melt value by karat at this week's price, what each kind of buyer pays, hallmarks, tax by country and the warning signs at the counter.
- Gold holds above $4,150 as the dollar climbs
At 5.22% yields and a rising dollar, gold would normally be crumbling. Central-bank buying is rewriting the playbook.