

Gold this week: price falls to a one-year low on oil fears
Week to Friday 30 October, and the week of 2 to 6 November.
Key points
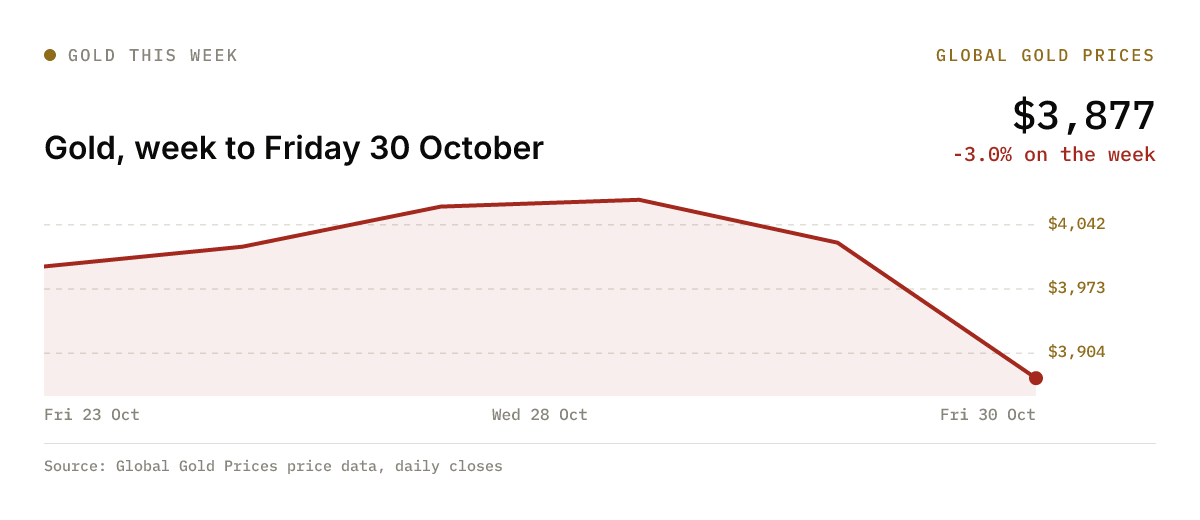
- Gold fell 3% on the week to about $3,877, its lowest close since October 2025 on our data
- Friday alone took off 3.6%, the biggest one-day drop since June
- US midterm elections on Tuesday and the Bank of England on Thursday test rate bets
- October payrolls land on Friday, the same day as Dhanteras in India
The gold price this week fell 3% to about $3,877 an ounce, its lowest close in a year, after a 3.6% slide on Friday as Brent crude pushed toward $117 and hot US inflation kept a December Fed hike in play. Next week's biggest test is Friday's US jobs report.
Why it matters: Buyers who waited for a dip now have one: gold is about 29% below January's record. Holders face a market where oil, not fear, is setting the direction, because dearer energy means higher rates for longer.
Last week in numbers
| Period | Gold (USD per ounce) |
|---|---|
| Friday close | $3,876.70 |
| 1 week | -3.0% |
| 1 month | -6.8% |
| Year to date | -10.4% |
| Below the record | -28.6% |
Friday's fall was bigger than 99% of daily moves since 1968 on our price data, and the largest since early June. October as a whole lost about 6.8%.
What moved gold last week
Why did gold fall when the dollar and yields eased?
Oil did the damage. Brent rose about 2% on Friday to around $117 a barrel, near a six-month high, after a tanker was attacked in the Strait of Hormuz and Houthi forces claimed new strikes on Saudi energy sites. Dearer energy lifts inflation, inflation keeps rate hikes on the table, and gold pays no interest.
The usual cushions did not help. Investing.com noted that gold fell even as the dollar and Treasury yields slipped. On our intraday data the selling came in three waves: about $40 in Asian hours, about $27 in London and about $80 in New York trade, where the heaviest losses came after the US open. Silver fared worse, losing about 6%, according to market reports.
Did the PCE report change the Fed picture?
It confirmed it. The September personal consumption expenditures index, released on Thursday, showed prices up 3.6% from a year earlier, from 3.4% in August, with core prices up 3.1%. Both matched forecasts, but they came a day after the Fed held rates and left a December hike open. Gold closed Thursday down 1.1% at about $4,023, as our Gold Performance report for 29 October showed. Our guide to how the Fed moves gold explains why that matters.
Was the first half of the week any better?
Yes, briefly. Gold regained $4,000 on Monday and climbed to about $4,069 by Wednesday's close, up 1.8% from the previous Friday, as hopes for Iran diplomacy cooled oil. Thursday and Friday wiped that out and more. Last week's edition, when gold first broke below $4,000, had flagged oil as the risk.
The week ahead
Will Friday's jobs report revive hike bets?
The October payrolls report is due on Friday 6 November. Trading Economics expects 56,000 new jobs after 29,000 in September, with unemployment at 4.2%. If hiring beats that, gold is likely to come under more pressure, because a firm job market makes a December hike easier to deliver. A weak number would give gold room to bounce. On our data gold fell on each of the last two payroll days, by 1.2% in September and 0.9% in October; across the last five, moves ranged from a 2.9% drop in June to a 1.6% gain in August.
What do the midterm elections mean for gold?
Americans vote on Tuesday 3 November. If the result points to more federal borrowing, Treasury yields could rise, which has tended to weigh on gold. If markets read it as gridlock, attention returns to oil and the Fed. A close result that takes days to count could add some demand for gold as a hedge.
Will the Bank of England hike on Thursday?
The Bank of England held rates at 3.75% in September in a 6 to 3 vote, with three members backing a rise to 4%. A Reuters poll in mid-October found most economists expect a hike to 4% this time, which would be its first in more than three years. A hike would likely lift sterling and trim the sterling gold price, now about 2,904 pounds an ounce.
Levels to watch
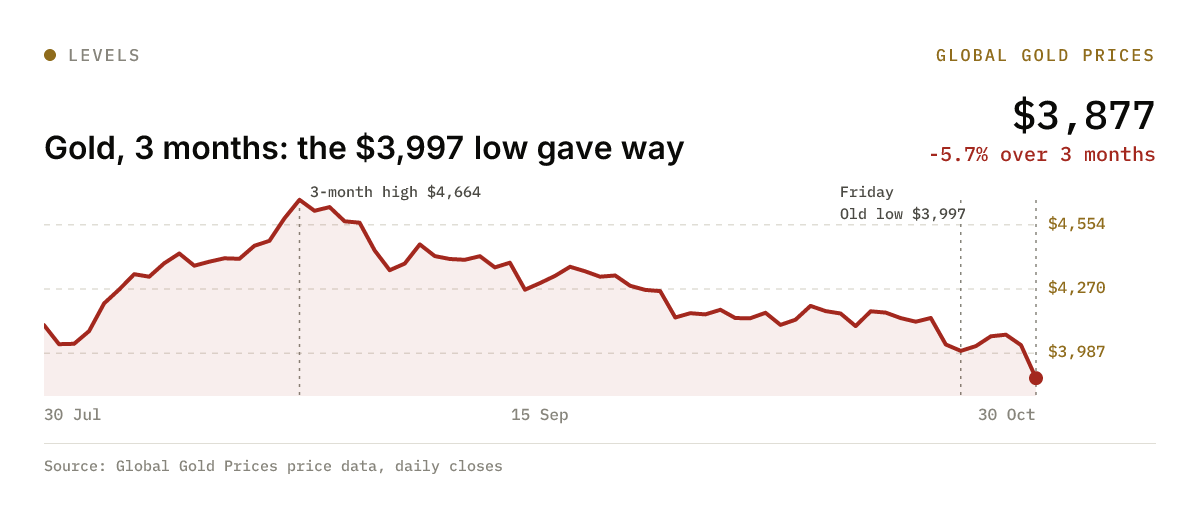
Support is thin below Friday's close. The last time gold closed lower was 1 October 2025, at about $3,872. Below that, the next closes on our chart sit near $3,826 from late September 2025, and some technical analysts name $3,800.
Resistance starts at about $3,997, last Friday's close and the old three-month low. Above that come Wednesday's close near $4,069 and then the 50-day average, about $4,259 on our data. The 200-day average is far above, near $4,495.
What to watch next week
- Mon 2 Nov: US ISM manufacturing survey: the first read on factory prices after the oil jump
- Tue 3 Nov: US midterm elections, the Reserve Bank of Australia decision and US JOLTS job openings
- Wed 4 Nov: ADP private payrolls and the ISM services survey, early clues for Friday
- Thu 5 Nov: Bank of England decision: a first hike in more than three years would move sterling gold
- Fri 6 Nov: US October jobs report, and Dhanteras in India, the main gold-buying day before Diwali on Sunday 8 Nov
Frequently asked questions
+Why did the gold price fall this week?
Higher oil prices and a hot US inflation reading kept a December Fed rate hike in play. Gold fell 3% on the week and 3.6% on Friday alone.
+How far is gold below its record high?
About 28.6%. Gold closed at a record of about $5,426 an ounce on 29 January 2026, against about $3,877 on Friday 30 October.
+What does 22K gold cost in Dubai after this week's fall?
About 420 dirhams a gram at Friday's close, before VAT and making charges, down from about 435 dirhams on Thursday.
+When is the next US jobs report?
Friday 6 November, covering October. Forecasts point to about 56,000 new jobs and a 4.2% unemployment rate.
More from the Markets desk
All Markets stories →Related reading
- Gold Performance 3rd November: gold price slips, US vote count up next
Tuesday 3 November: a firmer dollar and rising Treasury yields pulled gold back below $3,950 as Americans voted and bets on a December Fed hike climbed.
- Gold Performance 2nd November: gold price jumps 1.8%, US vote up next
Monday 2 November: a 7% slide in oil on hopes of US talks with Iran eased Fed hike bets and gave gold its best day since early September.
- Gold and inflation: why an energy shock is hurting gold
Gasoline is up 34% on the year and inflation is back near 4%, yet gold is down. The answer is in how the Fed responds, and history shows both outcomes.