

Gold technical analysis: $4,200 is the line to beat
The rebound from the one-year low has met the first resistance; the 50-day and 200-day averages show what it has to do next.

Key points
- Gold closed the week near $4,072, about 3% below its 50-day average of $4,200
- The 200-day average near $4,465 lines up with a 38.2% retracement of the fall from the record
- Support sits at $4,000, then about $3,931 and the one-year low near $3,876
- Momentum is neutral: a 14-day RSI near 45 on our calculation
This gold technical analysis starts with one level: $4,200. Gold closed Friday near $4,072 after its best week since August, and the 50-day moving average sits just above $4,200, about 3% higher. Until the price closes above it, the bigger trend from January's record remains down, on our price data.
Where does gold stand after the rebound?
Gold has bounced 5.1% from its one-year low of about $3,876 on 30 October. That sounds large, and against history it is: a rise this size in a week is bigger than 97% of 7-day stretches since 1968, by our calculation. But it has recovered only about 12.6% of the fall from the record of $5,426 to that low.
The averages show where the chart sits:
| Measure | Level | Gap from close |
|---|---|---|
| Friday close | $4,072 | |
| 50-day average | $4,200 | +3.1% |
| 200-day average | $4,465 | +9.7% |
| 3-month high (24 Aug) | $4,664 | +14.5% |
| One-year low (30 Oct) | $3,876 | -4.8% |
Both averages are above the price and the 50-day is below the 200-day. In plain words, the short-term trend and the long-term trend both still point lower. One good week does not change that.
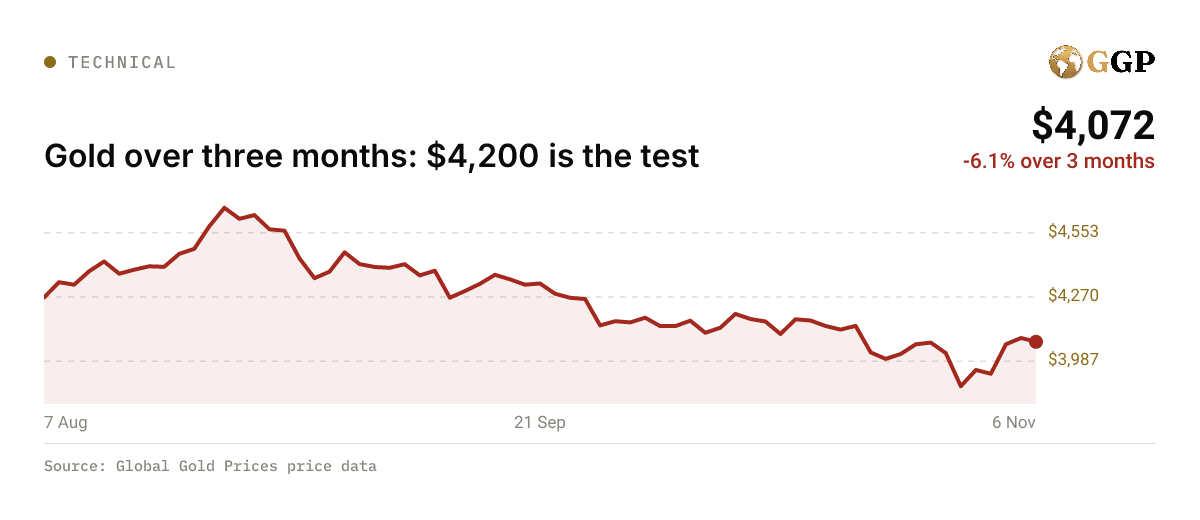
| Point | Price |
|---|---|
| 7 Aug | $4,268 |
| 21 Sep | $4,330 |
| 6 Nov | $4,072 |
| High | $4,664 |
| Low | $3,876 |
| Change over the chart | -4.59% |
What is the bull case?
The rebound would gain weight with a daily close above $4,146, the intraday high gold reached on Thursday before the Bank of England decision. Above that, the 50-day near $4,200 is the real test.
A close above $4,200 would be the first since late September. It would put the next level in view at about $4,242, the 23.6% retracement of the fall from the record. Beyond that, the 200-day average near $4,465 and the 38.2% retracement at about $4,469 sit within a few dollars of each other. When two measures agree like that, the level tends to attract both buyers taking profit and sellers waiting for a bounce.
What is the bear case?
The first line is $4,000. Gold regained it on Wednesday and has closed above it for three days. A close back below would suggest the midterm rally was a short squeeze rather than a turn.
Under $4,000, Tuesday's close near $3,931 is the next support, then the 30 October low near $3,876. A break of that low would mean a new 52-week low and would open the way to levels gold has not seen since late 2025.
How does this compare with the last rebound?
The August rally is the obvious comparison. Gold rose from about $4,028 on 3 August to $4,664 on 24 August, a gain of almost 16% in three weeks, on our price data. It then failed, and the 24 August close is still the high of the past three months.
October gave a second lesson. Gold closed near $4,196 on 9 October and near $4,172 on 15 October, and each time sellers pushed it back. That band from about $4,170 to $4,200 is where the October rebounds died, and it sits right under the 50-day average. A level that has turned the price twice tends to matter a third time.
So far this rebound is smaller and slower than August's. It has the same problem October had: the first real test is a zone where sellers have been waiting.
What do momentum and volatility say?
Momentum is neither stretched nor weak. Our 14-day relative strength index is near 45, using a simple average of daily changes, which sits in the middle of its 0 to 100 range. The rebound has erased the oversold reading from late October without tipping into overbought.
Volatility is high but not unusual for this year. Gold's 30-day realised volatility is about 24% annualised, close to its one-year average of 24% and well above the long-run average of about 14% since 1990, on our data. Swings of $50 to $100 a day remain normal, which is why levels matter more than single closes.
For the levels as they stood a fortnight ago, see our earlier gold technical analysis on $4,000 lost. The live gold price shows where the spot price trades now.
How do the week's events fit the chart?
Fundamental news lines up with the chart's indecision. The US midterm result pulled the dollar and yields down, Kitco reported, and lifted gold through $4,000. Friday's strong jobs report kept a December Fed hike in play and capped the move below $4,100. The chart reflects a market caught between those two forces.
This is a description of conditions, not a trading call. Levels fail as often as they hold, and a single data release can move gold through several of them in a day.
What to watch
- 10 Nov: US October CPI, the most likely trigger for a test of $4,200 or $4,000
- 13 Nov: CFTC positioning report, which shows whether funds chased the rebound
- 13 Nov: weekly close, the first chance to confirm a move above or below $4,146
More from the Technical Analysis desk
All Technical Analysis stories →Related reading
- China gold reserves: PBOC adds 26t, nears France
The People's Bank of China bought its most gold in three years as prices fell almost 7% in October, extending its streak to 24 months.
- Jobs report and gold price: payrolls back a Fed hike
October's 165,000 jobs kept a December Fed hike close to priced in, and gold's dip was bought within hours.
- Gold price this week: best week since August, CPI next
The gold price rose about 5% this week to near $4,072, its best week since August, as the US midterm elections, a Bank of England rate rise and the jobs report moved markets. Next up: US inflation data on Tuesday.