

Gold price this week: worst week since March, Fed next
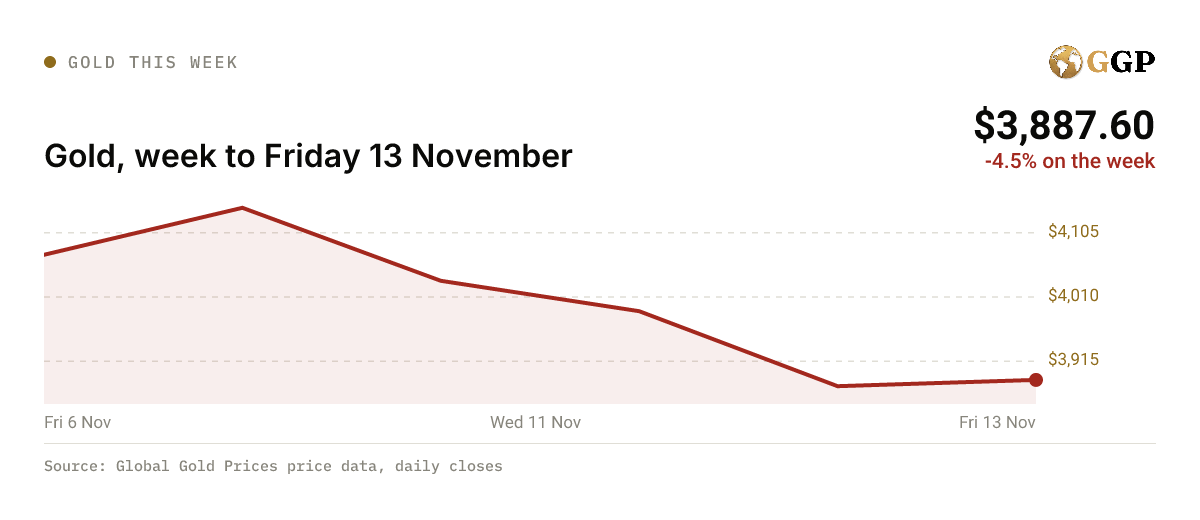
The gold price fell about 4.5% this week to near $3,888, its worst week since March, as hot US inflation data and Treasury yields above 5% lifted bets on a December Federal Reserve rate hike. Next up: the Fed's meeting minutes on Wednesday.
Key points
- Gold fell 4.5% to about $3,888, its worst week since March, as hot US inflation lifted Fed hike bets
- The 10-year Treasury yield ended the week near 5.13% and the dollar hit a 19-month high
- Fed meeting minutes on Wednesday will show how close officials came to a December hike
- US retail sales on Tuesday are the week's main test of US spending
The gold price this week fell about 4.5% to near $3,888 an ounce, its worst week since March. Hotter US consumer prices and Treasury yields above 5% raised the odds of a Federal Reserve rate hike in December. The main event in the coming week is Wednesday's release of the Fed's October meeting minutes.
Last week in numbers
| Period | Gold price (USD per ounce) |
|---|---|
| Friday close | $3,887.60 |
| 1 week | -4.5% |
| 1 month | -5.3% |
| 3 months | -11.5% |
| Year to date | -10.2% |
| From the record | -28.4% |
The record close was $5,426.41 at the end of January. Friday's close sits only about $11 above the one-year low close of $3,876 from the last trading day of October.
| Market | Friday's gold price |
|---|---|
| UAE, 24K per gram | AED 459.02 |
| UAE, 22K per gram | AED 420.77 |
| India, 24K per 10 grams | Rs 117,598 |
| India, 22K per 10 grams | Rs 107,798 |
| Euro area, per ounce | €3,512 |
| UK, per ounce | £2,936 |
Local prices are our spot price converted at Friday's exchange rates, before local taxes, duties and dealer premiums. See the gold price in India, the gold price in the UAE, the gold price in the UK and the gold price in euros for today's figures, or the live gold price for the spot price in dollars.
| Point | Price |
|---|---|
| Fri 6 Nov | $4,072 |
| Wed 11 Nov | $4,034 |
| Fri 13 Nov | $3,888 |
| High | $4,141 |
| Low | $3,878 |
| Change over the chart | -4.53% |
On our price data since 1968, a 4.5% drop over seven days is bigger than about 97% of all seven-day stretches. It is also the steepest Friday to Friday fall since the week to 20 March.
What moved gold last week
Why did gold drop after the US inflation report?
The Bureau of Labor Statistics said consumer prices rose 0.4% in October, against forecasts of 0.3%, and core prices rose 0.3% for a third month. Hours earlier, Fed Governor Christopher Waller had said a half-point rise "should be considered" if core inflation ran at about 0.3% or more. Gold fell 2.6% on Tuesday, as our Tuesday edition reported, and wiped out Monday's 1.7% gain.
Why did the dollar and yields keep pushing gold lower?
The dollar index rose to about 103.2 on Thursday, its highest since April 2025, Reuters reported. The 10-year Treasury yield climbed back above 5% after a weak sale of 30-year bonds. Cleveland Fed President Beth Hammack and San Francisco Fed President Mary Daly both said more tightening was needed. By Friday, futures priced about an 89% chance of a quarter-point Fed rate hike on 9 December. Gold pays no interest, so higher yields raise the cost of holding it, as we explain in why gold falls when rates rise.
Why did oil not help gold this week?
Oil worked against gold. On Monday, Brent crude fell 5.8% to near $92.60 after President Donald Trump said new strikes on Iran were "highly unlikely", and gold rose because cheaper energy eases inflation. By Friday Brent was back near $95.50, as the standoff over the US naval blockade of Iran dragged on. Dearer oil feeds inflation, so it adds to the case for rate hikes. Friday's producer price index rose 0.3% on the month, below the 0.4% forecast, but its yearly rate reached 6.5%, the highest since November 2022, Kitco News reported. Gold gained only 0.2%.
Levels to watch for gold
Support starts at the one-year low close near $3,876. Below that, Thursday's intraday low near $3,854 is the next marker, then the late September 2025 area around $3,770, where gold last traded before its run to the January record.
Resistance is layered above. The round $4,000 comes first, then the 20-day average near $4,026, Monday's close near $4,141 and the 50-day average around $4,157. The 200-day average is far higher, near $4,442. Gold has closed below it every day since early September, on our data.
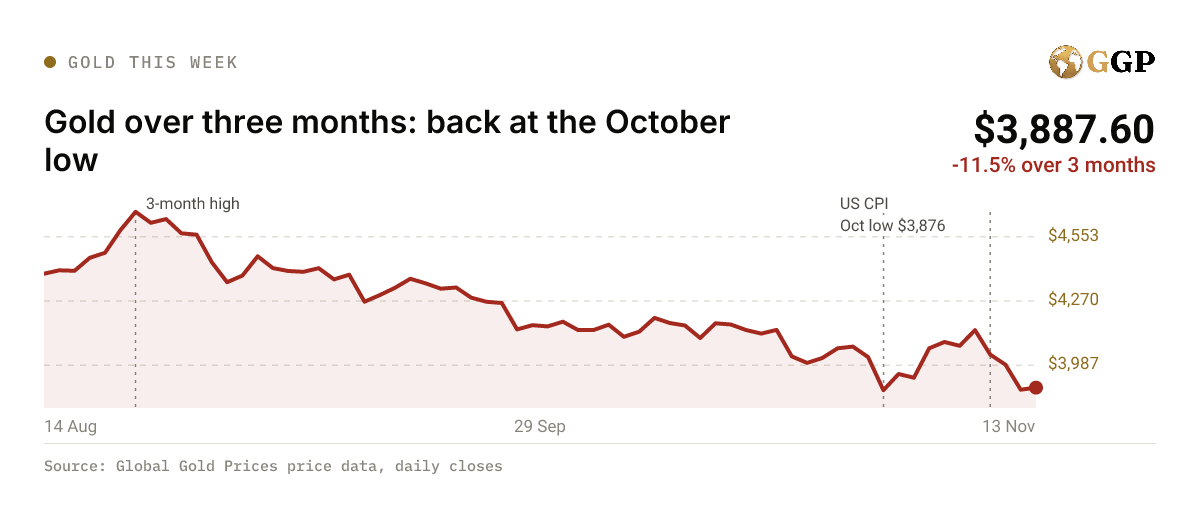
| Point | Price |
|---|---|
| 14 Aug | $4,391 |
| 29 Sep | $4,163 |
| 13 Nov | $3,888 |
| High | $4,664 |
| Low | $3,876 |
| Change over the chart | -11.46% |
The week ahead for gold
Will the Fed minutes push gold lower?
The minutes of the 27 and 28 October meeting come out on Wednesday afternoon in Washington. That meeting held rates at 3.75% to 4.00%, with two officials voting for a hike. Fed Chair Kevin Warsh also speaks on Monday. If the minutes show several more officials ready to hike, gold is likely to come under more pressure, because the dollar and yields would rise. If they show doubts about tightening, gold could bounce toward $4,000. Last time the Fed spoke, gold fell about 1.1% the day after the decision and another 3.6% the day after that, on our data.
Will US retail sales change the picture for gold?
October retail sales are due on Tuesday. One preview from the Global Macro Week Ahead newsletter looks for a flat reading after a 0.8% rise in September. A strong figure would back the case for a December hike and could weigh on gold. A weak one would do the opposite. After this week's CPI surprise, gold fell 2.6% in a day, which shows how sharply it can react to US data.
Does UK inflation matter for gold?
UK consumer prices for October are due on Wednesday, with forecasts near 3.6%, up from 3.5%. A high figure would support sterling and could take some heat off the dollar, which would help gold in dollar terms. Seasonally, November has been a little better than average: on our data it has been up in 36 of 58 years, with an average gain of 0.8%.
Important dates for gold
- Mon 16 Nov: China's October activity data and a speech by Fed Chair Kevin Warsh
- Tue 17 Nov: US October retail sales and the Reserve Bank of Australia's minutes
- Wed 18 Nov: Fed minutes from the October meeting and UK October inflation
- Thu 19 Nov: US weekly jobless claims and the Philadelphia Fed survey
- Fri 20 Nov: China's loan prime rates and UK October retail sales
Frequently Asked Questions
+How much did the gold price fall this week?
Gold fell 4.5% in the week to Friday 13 November, from about $4,072 to $3,888 an ounce on our price data. It was the worst week since March and left gold 10.2% lower this year.
+Why is gold falling?
Hot US inflation data raised bets on a Federal Reserve rate hike in December, which lifted the dollar to a 19-month high and the 10-year Treasury yield above 5%. Gold pays no interest, so higher yields make it less attractive.
+What is the next big event for gold?
The Fed's minutes from its October meeting on Wednesday 18 November. They will show how many officials were ready to raise rates, a guide to the 9 December decision.
+Where is support for the gold price?
The first support is the one-year low close near $3,876, then Thursday's intraday low near $3,854. Resistance sits at $4,000, the 20-day average near $4,026 and the 50-day average near $4,157.
More From the Markets Desk
All Markets stories →Related Reading
- Resolute Mining guidance rests on $4,000 gold
Resolute Mining's 2026 guidance assumes a $4,000 gold price, about 3% above Friday's close, though its mines in Mali and Senegal still clear their costs by about $1,380 an ounce on our numbers.
- Gold 2x ETF and 3x funds: how leveraged gold works
Gold rose about 2% over the past year, but a fund resetting to twice the daily move would have lost about 3%, and a 3x fund about 13%, on our price data. Here is why, and which leveraged gold funds trade today.
- Gold ETF India guide: costs, tax and how they compare
Indian gold ETFs charge about 0.44% to 0.81% a year, ₹440 to ₹810 on every ₹1 lakh, with 24 carat gold near ₹12,300 a gram at the world price. How they compare with Sovereign Gold Bonds, gold funds and jewellery.