

Gold support levels: why $3,876 is the line to hold
The gold price closed the week near $3,888, about $11 above its one-year low close of $3,876, after a 4.5% fall that left it below its 20, 50 and 200 day averages. The Fed minutes on Wednesday are the next test of that floor.
Key points
- Gold closed Friday near $3,888, only about $11 above its one-year low close of $3,876
- It trades below its 20, 50 and 200 day averages, a downtrend on every timeframe we track
- 30-day volatility is about 24% a year, roughly 1.5 times gold's long-run norm
- A close below $3,876 opens the late September 2025 area near $3,770
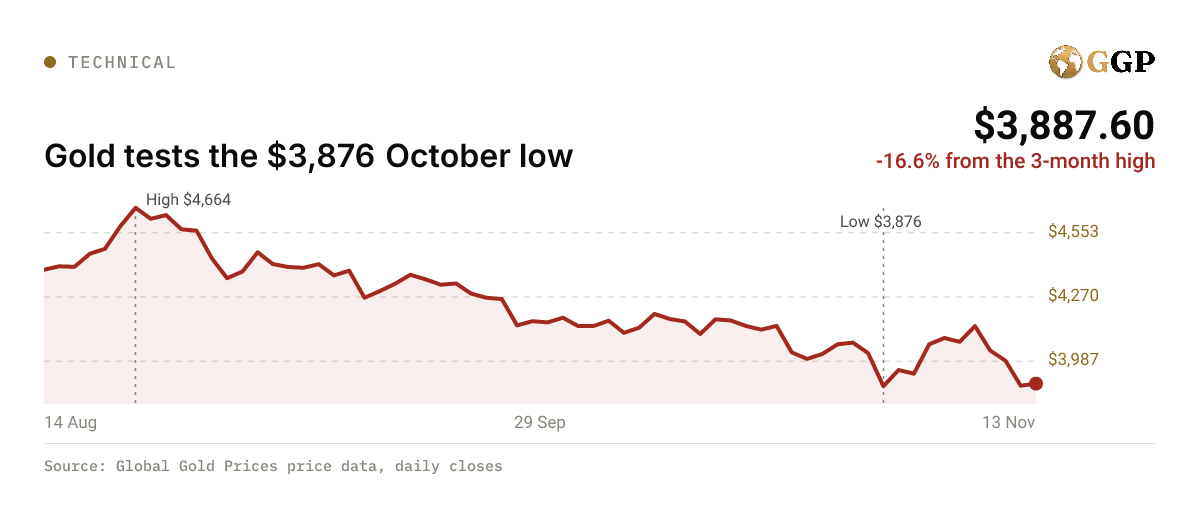
Gold support levels have narrowed to one line: the October low close near $3,876. Gold ended Friday near $3,888 an ounce after a 4.5% weekly fall, about $11 above that level. Our read: as long as gold closes above $3,876 the floor holds, but a close below it would put $3,770 in view.
Why it matters: Gold bounced from $3,876 on 30 October, and on Thursday it dipped to about $3,854 but closed back above it. A close below would remove the last support from this year's range.
The live gold price page shows the spot price as these levels are tested.
| Point | Price |
|---|---|
| 14 Aug | $4,391 |
| 29 Sep | $4,163 |
| 13 Nov | $3,888 |
| High | $4,664 |
| Low | $3,876 |
| Change over the chart | -11.46% |
Where are the support levels for gold?
The first is the one-year low close of about $3,876, set on 30 October. It is the line that matters most this week.
The second is Thursday's intraday low near $3,854, a 13-month low. Gold steadied soon after and spent the afternoon above $3,875, so buyers were waiting, but intraday lows break more easily than closes.
Below those, our price history shows the late September 2025 area near $3,770, where gold closed the week of 26 September 2025. Gold moved through that zone quickly in late 2025 on its way to the January record of $5,426, so there is little trading history to slow a fall between $3,876 and $3,770.
How deep is gold's pullback?
Gold is about 28% below its record close of $5,426 from 29 January, on our data. The fall from the three-month high of about $4,664 on 24 August is about 16.6%, in under three months. Year to date, gold is down about 10.2%.
The shape matters as much as the size. Each rally since August has stopped at a lower high: about $4,196 in early October, then about $4,141 this Monday. Each low has been near or below the last. That is the textbook pattern of a downtrend, and it will only change when gold makes a higher high, which on today's chart means a close above Monday's $4,141.
Headlines this week compared the slide with 2013, when gold fell about 27% over the year on our data. The comparison is loose. In 2013, the Fed was preparing to slow its bond buying; today it is close to raising rates with the 10-year Treasury yield above 5%.
Where is resistance for gold?
Resistance sits in layers above.
- About $4,000, the round number gold lost on Wednesday
- About $4,026, the 20-day moving average
- About $4,141, Monday's close and this week's high
- About $4,157, the 50-day moving average
- About $4,442, the 200-day moving average
Gold has not closed above its 200-day average since early September, on our data. A downtrend is when the shorter averages sit below the longer ones and price sits below all of them. That is the picture now.
What does gold's momentum say?
Momentum is weak but not stretched. The 14-day relative strength index (RSI), our calculation from daily closes, is about 42. Readings under 30 are usually called oversold, so there is room for more selling before sellers run out of steam.
Volatility is high. Gold's 30-day realised volatility is about 24% a year, on our data, roughly 1.5 times its average of about 16% since 1970. Wider daily swings mean a level can break and recover in the same session, which is why we prefer to judge support on closing prices.
What are the banks saying about gold?
TD Securities' Bart Melek warned on 11 November that a test of the $3,900 area was likely as long as rates and the dollar held up, IndexBox reported. Gold reached that area the next day. Goldman Sachs cut its forecast for the end of 2026 to $4,150 earlier this month, Reuters reported, a level that would put gold back near its 50-day average.
Our scenarios for gold
The bull case
Gold holds above $3,876 on a closing basis and climbs back over $4,000. A close above $4,026, the 20-day average, would be the first sign the selling has run its course. A breakout above Monday's $4,141 would end the run of lower highs and put the 50-day average near $4,157 in play. The Fed minutes on Wednesday are the likely trigger in either direction.
The bear case
Gold closes below $3,876. That would mark a lower low on the daily chart and leave $3,770 as the next level with real trading history. With volatility near 24% a year, a move of that size could take only a few sessions, so a weekly close below $3,876 would carry more weight than a single bad day. Our previous outlook, $4,200 is the line to beat, named the 50-day average as the test for the bulls. Gold failed it and has fallen about 4.5% since.
This is a reading of conditions, not a forecast or trading advice.
What to watch
- Wed 18 Nov: Fed minutes from the October meeting, the likely trigger for a test of $3,876
- Tue 17 Nov: US October retail sales, a read on whether US data keeps yields above 5%
- Fri 20 Nov: the weekly close, our measure of whether $3,876 held
More From the Technical Analysis Desk
All Technical Analysis stories →Related Reading
- Gold price and Treasury yields: how 5% broke $4,000
The gold price fell about 4.5% this week to near $3,888 as hot US inflation data pushed the 10-year Treasury yield to about 5.13% and the dollar to a 19-month high. Next up: US retail sales on Tuesday and the Fed minutes on Wednesday.
- Resolute Mining guidance rests on $4,000 gold
Resolute Mining's 2026 guidance assumes a $4,000 gold price, about 3% above Friday's close, though its mines in Mali and Senegal still clear their costs by about $1,380 an ounce on our numbers.
- Gold 2x ETF and 3x funds: how leveraged gold works
Gold rose about 2% over the past year, but a fund resetting to twice the daily move would have lost about 3%, and a 3x fund about 13%, on our price data. Here is why, and which leveraged gold funds trade today.